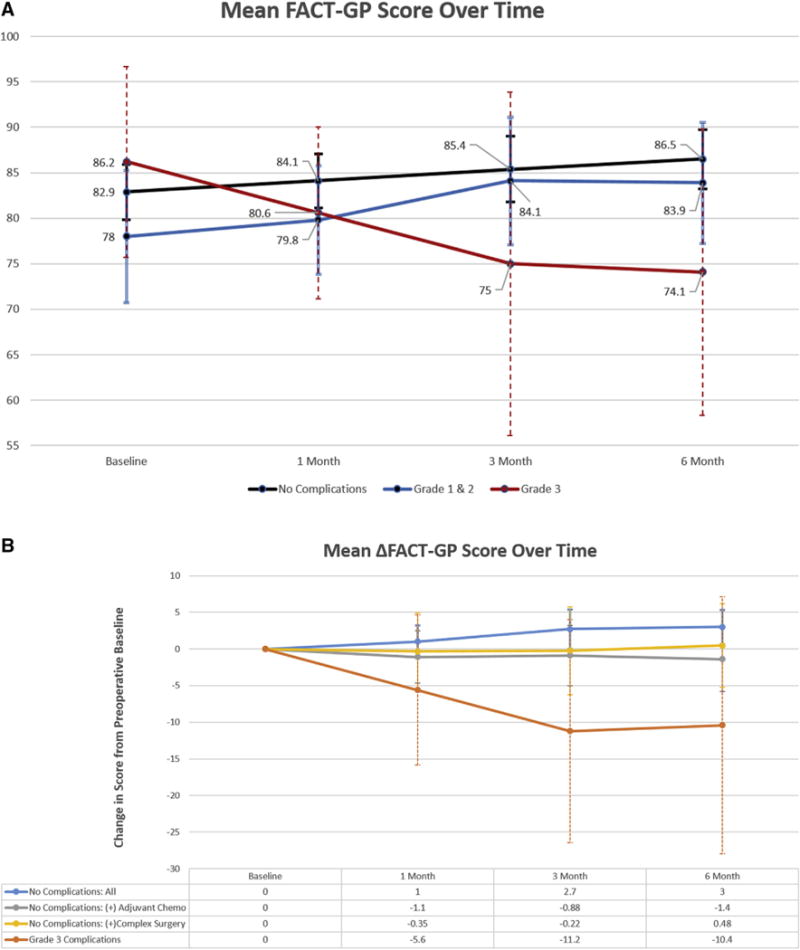
FIGURE 2. Health-related quality of life score trends.

Health-related quality of life score trends: from baseline to 6 months postoperatively. A, Mean scores of women with no complications (n = 137), grade 1 and 2 complications (n = 41), and severe grade 3 complications (n = 6). B, Change in mean scores from baseline values, comparing those with severe grade 3 complications vs other postoperative groups without complications: women undergoing adjuvant chemotherapy (n = 51) and those who required complex surgery (n = 23).
