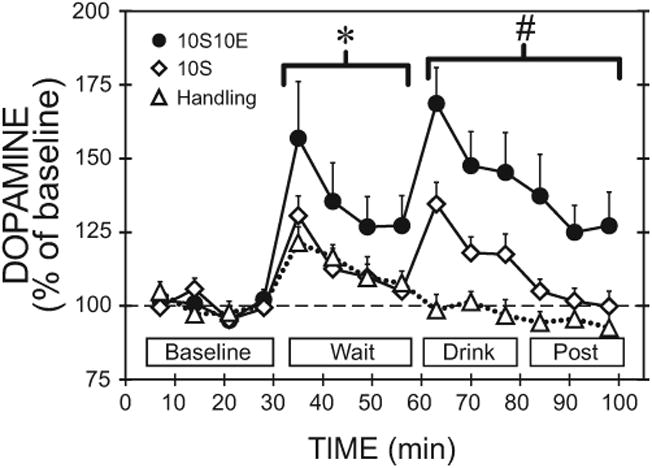
Fig. 4.

Medial prefrontal cortex dopamine relative to home cage baseline during home cage baseline, wait, drink and postdrink periods. The data shown in Fig. 2 were transformed to percent of home cage baseline. For clarity, only group comparisons are shown on the figure as follows. *Significant difference between the 10S10E group compared with either the 10S or handling groups during the wait period. #Drink and postdrink period dopamine responses above baseline were significantly different in each group compared with the other 2 groups. Overall, significant main effects of time, group, and a group-by-time interaction occurred. Data represented as mean ±SEM for most points, but selected error bars are omitted for clarity (n =9 for each group). 10S10E = 10% sucrose + 10% ethanol, 10S = 10% sucrose.
