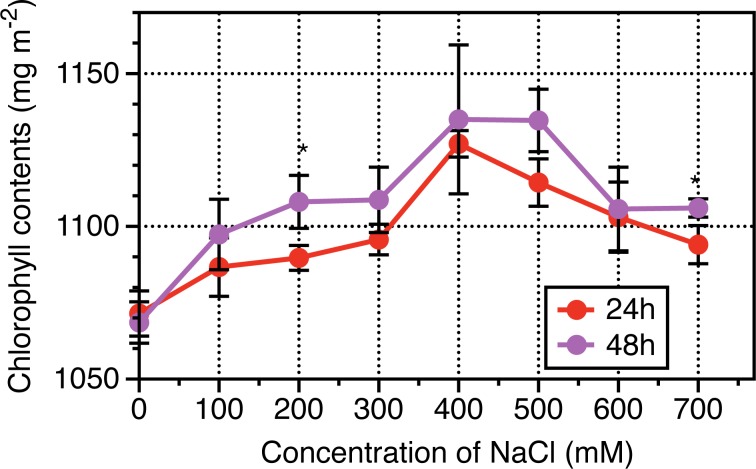
Fig 2. Dynamic response of leaf-based chlorophyll content to a range of NaCl concentration for 24 hours and 48 hours in Leymus chinensis.
Vertical bars represent mean values plus standard error values. Student t-test was used to compare significant differences between NaCl-treated duration of 24h and 48h, while symbol “*”, “**” represent P <0.05 and 0.01, respectively. At least 5 biological replicates were conducted.

