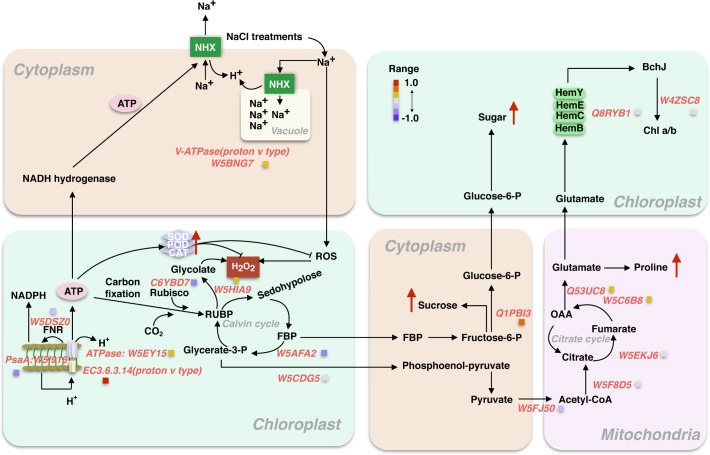
Fig 7. Schematic diagram summarized from the expression of 44 proteins relating to biosynthesis of amino acids and carbon metabolism in response to salt stress.
For clear illustration, the evented organelle or regions at cellular levels were separated, while the color of light orange, light green and light pink represent cytoplasm, chloroplast and mitochondria, respectively. The red arrow indicated the relatively expressed levels of each component in 600mM NaCl compared with 400mM from independently experimental measurements.

