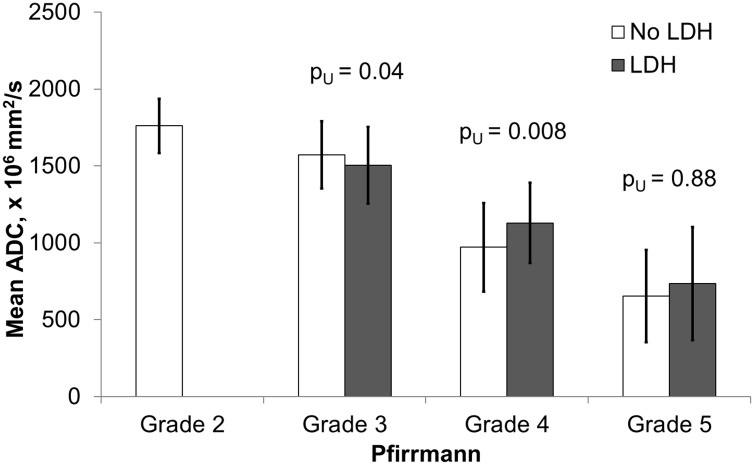
Fig 13. Assessment of ADC values from herniated and non-herniated disks in various Pfirrmann degeneration grades.
Diagram of mean ADC values in herniated and non-herniated intervertebral disks stratified y the Pfirrmann grades. Significant differences were observed in the Pfirrmann grades 3 and 4. Totally 114/452 (25%) disks were included in the analysis as herniated (grade 3, n = 42; grade 4, n = 57 and grade 5, n = 15), 316/452 (70%) as non-herniated (grade 2, n = 114; grade 3, n = 150; grade 4, n = 48; grade 5, n = 4), and 22/452(5%) disks were excluded from the analysis due to spondylolisthesis or lumbar stenosis without herniation. ADC, apparent diffusion coefficient, LDH, lumbar disk herniation.

