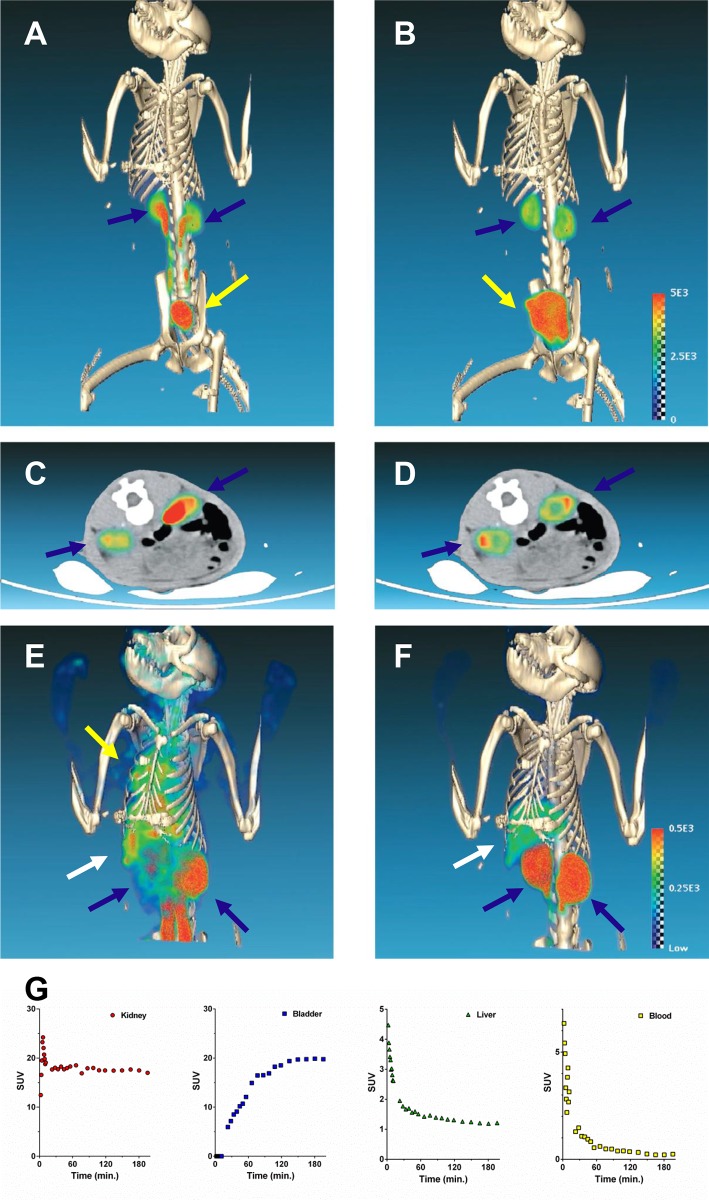
Fig 2. Dynamic PET/CT images of [86Y]fCNT in a cynomolgus monkey showing renal and hepatic processing activity.
(A) Maximum intensity projection (MIP) image immediately following intravenous injection shows rapid kidney accumulation (blue arrows) and elimination of urine into the bladder (yellow arrow); (B) MIP of the same animal at 1.5 hours; (C) Axial image of the kidneys (blue arrows) immediately following intravenous injection; and (D) Axial image of the kidneys at 1.5 hours. (The scale bar is the same for panels A-D.) (E) MIP image immediately following intravenous injection shows diffuse blood compartment and heart activity (yellow arrow) as well as kidney (blue arrow) and liver (white arrow) accumulation of activity; (F) MIP of the same animal at 1.5 hours after the blood compartment activity clears and all of the activity has distributed or been eliminated. (The scale bar is the same for panels E and F.) Time activity curve (TAC) data for (G) kidney, urine in bladder, liver, and blood.

