
Fig. 4. Single-pulse imaging of a photon-activated gold NP in the ballistic regime.
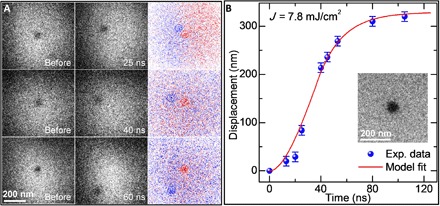
(A) Single-pulse images of the photon-activated NP at three specific delay times. The images in the first and second columns are the states of the NP before the laser pulse and at specific delays of 25, 40, and 60 ns after the laser pulse (fluence of 7.8 mJ/cm2), respectively. The third column shows the corresponding difference images obtained by subtracting the single-pulse image before the laser pulse from that at the short delay time. The red and blue dashed circles indicate the NP positions before the laser pulse and at short delays after the laser pulse, respectively. (B) Evolution of the displacement of the NP as a function of delay time with a physical model fit. The inset shows the image of the measured gold NP.