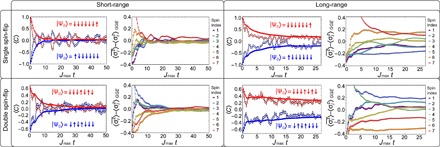
Fig. 2. Measured location of spin excitation.

The average position of the spin excitation, 〈C〉, is plotted for an initial excitation on the left (dark blue unfilled squares) and right (dark red unfilled circles) along with their cumulative time average (blue and red filled circles and squares) for short-range (α = 1.33) and long-range (α = 0.55) interactions with initial states with one spin excitation (top panels) and two spin excitations (bottom panels). The cumulative time average of the deviation of the postselected individual spin projections from the GGE, , is also plotted. For short-range interactions, the spins quickly thermalize to a value predicted by the GGE, but for the long-range interacting system, a new type of prethermal state emerges. Error bars are statistical, calculated on the basis of quantum projection noise and calibrated detection errors (38).
