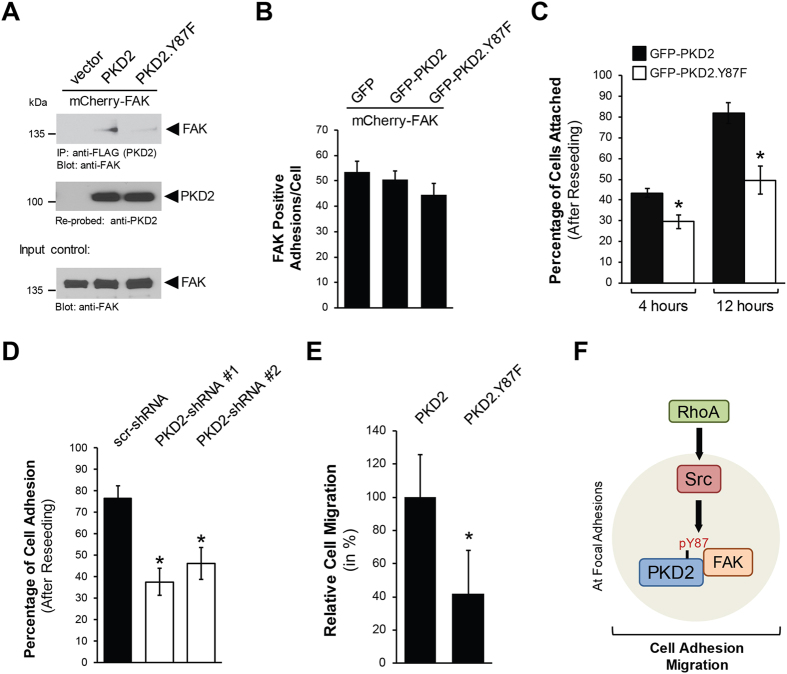
Figure 6.
Prevention of Y87-phosphorylation decreases cell adhesion and cell migration. (A) Hek293T cells (0.5 × 10⁶ cells/well, 6 well plate) were co-transfected with vector control or FLAG-tagged versions of PKD2 or PKD2.Y87F together with mCherry-FAK. PKD2 was immunoprecipitated (anti-FLAG) and analyzed for co-immunoprecipitated FAK. Immunoprecipitates were then re-probed for PKD2. Control Western blot was probed for FAK expression. Uncropped blots are shown in Supplemental Figure S9. (B) HeLa cells were co-transfected with GFP or GFP-tagged versions of PKD2 or PKD2.Y87F together with mCherry-FAK and then re-plated on fibronectin-coated (2 μg/ml) glass coverslips at a density of 0.03 × 10⁶ cells per coverslip. Fluorescent images were acquired and numbers of FAK-positive adhesions were determined. Shown is a quantitation for the number of FAK-positive adhesions per double transfected cell, with GFP (n = 50 cells), GFP-PKD2 (n = 39 cells) and GFP-PKD2.Y87F (n = 46 cells). (C) HeLa cells were transfected with GFP-tagged versions of PKD2 or PKD2.Y87F and then re-plated on fibronectin-coated (10 μg/ml) glass coverslips at a density of 0.02 × 10⁶ cells per coverslip. Fluorescent images were acquired at the indicated times to determine the number of cells attached. Shown is a quantitation for the percentage of cells attached at 4 and 12 hours (images are shown in Supplemental Figure S6B). Error bars represent standard error of the mean (SEM). * indicates statistical significance (p < 0.05) as compared to wildtype control at the time point measured. (D) HeLa cells were infected with lentivirus expressing non-target shRNA (scr-shRNA), or two independent shRNA sequences targeting PKD2 (PKD2-shRNA#1, PKD2-shRNA#2). After 48 hours, cells were re-plated on fibronectin-coated (10 μg/ml) glass coverslips at a density of 0.02 × 10⁶ cells per coverslip. Fluorescent images were acquired to determine the number of cells attached. Shown is a quantitation for the percentage of cells attached at 8 hours. Error bars represent standard error of the mean (SEM). * indicates statistical significance (p < 0.05) as compared to wildtype control at the time point measured. (E) HeLa cells were transfected with GFP-tagged versions of PKD2 or PKD2.Y87F and then seeded on Transwell plates. After 16 hours, cells that had migrated to the lower surface of the filters were fixed in 4% paraformaldehyde and counted. Shown is the relative cell migration with PKD2 set as 100%. Error bars represent standard error of the mean (SEM). *Indicates statistical significance (p < 0.05) as compared to wildtype control at the time point measured. (F) Model of how PKD2 tyrosine phosphorylation at Y87 is regulated at the focal adhesions and functional consequences of this event on cell adhesion and migration.

