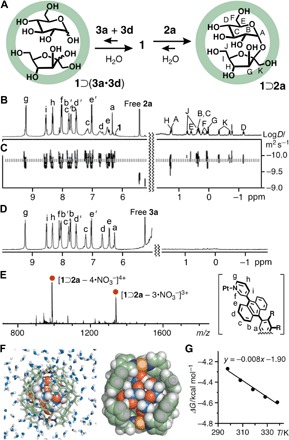
Fig. 3. Encapsulation of d-sucrose within capsule 1 in water.

(A) Schematic representation of host-guest interactions between capsule 1, d-glucose (3a), and d-fructose (3d) (left) and the encapsulation of d-sucrose (2a) within 1 (right). (B) 1H NMR and (C) 1H DOSY NMR spectra (500 MHz, D2O, room temperature) of 1⊃2a. (D) 1H NMR spectrum (500 MHz, D2O, room temperature) of a mixture of 3a and 3d with 1. (E) ESI-TOF MS spectrum (H2O, room temperature) of 1⊃2a. (F) Structure of 1⊃2a in water (left) and its slice through the center (right) (substituents and counterions are omitted for clarity). (G) van’t Hoff plot for the thermodynamic parameters of 1⊃2a.
