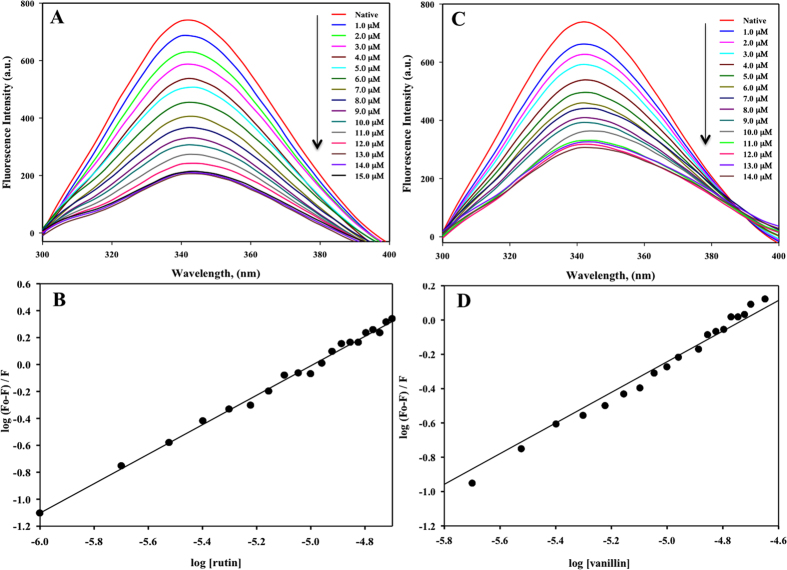
Figure 3.
Binding studies of rutin and vanillin with MARK4 using fluorescence spectroscopy. (A) Fluorescence spectra of MARK4 (5 µM) with increasing concentration of rutin (0–15 µM). Excitation wavelength was fixed to 280 nm and emission was recorded in the range 300–400 nm. (B) Modified Stern-Volmer plot showing quenching of MARK4 by rutin used to calculate binding affinity (K a) and number of binding sites (n). (C) Fluorescence spectra of MARK4 (5 µM) with increasing concentration of vanillin (0–14 µM). Excitation wavelength was fixed to 280 nm and emission was recorded in the range 300–400 nm. (D) Modified Stern-Volmer plot showing quenching of MARK4 by vanillin.

