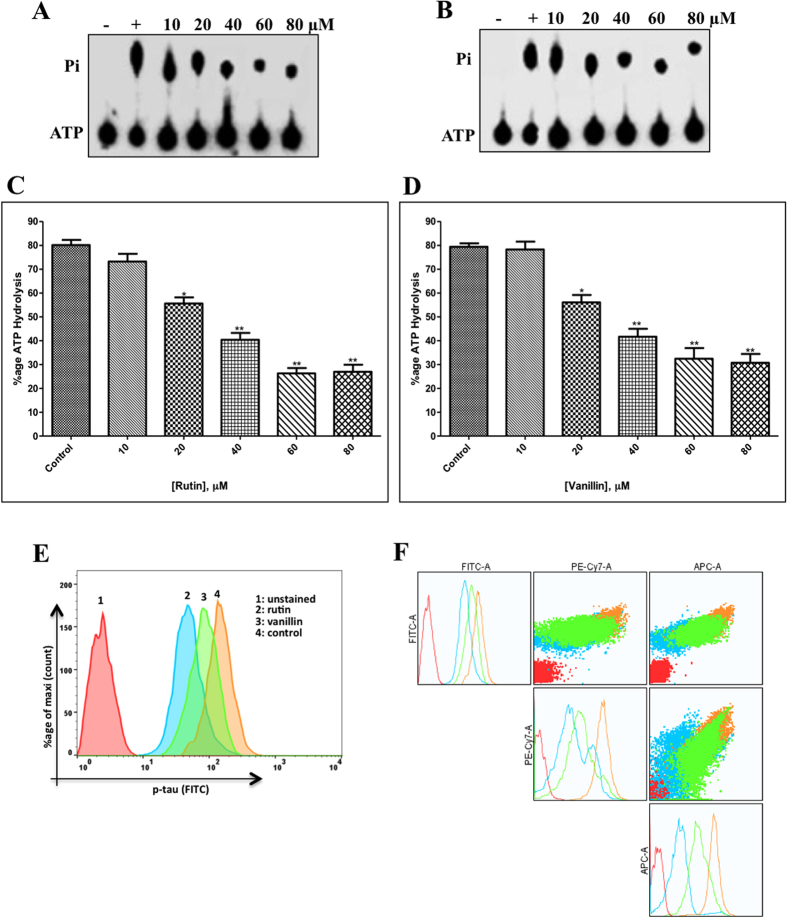
Figure 4.
ATPase enzyme inhibition and tau-phosphorylation assay of MARK4. (A,B) Shows the hydrolysis of Pi from ATP, position of Pi and ATP spots are indicated on left side. Lane 1, negative control (without protein); lane 2, 100 nM MARK4 (positive control); and lanes labeled as 10,20,40,60 and 80, shows the concentration of rutin and vanillin in µM incubated with 100 ng MARK4, respectively. (C,D) ATPase inhibition (% hydrolysis of ATP) with increasing concentrations of rutin and vanillin are shown in bar diagram. Bar graph represents the normalized intensity of ATP hydrolysis for duplicate measurements ± SD. *p < 0.05; **p < 0.01, compared with the control. Statistical analysis was done using Student’s t- test for unpaired samples. (E) Representative flow cytometry histogram of SH-SY5Y cell fractions stained with phosphorylated anti-tau antibodies, each histogram represents the phosphorylation status of tau under different treatments as mentioned in inset (F) NXN plot of SH-SY5Y cells treated with rutin and vanillin stained with phosphorylated anti-tau. It represents the multiple parametric analysis of cell fractions under different treatments stained with phosphorylated anti-tau.

