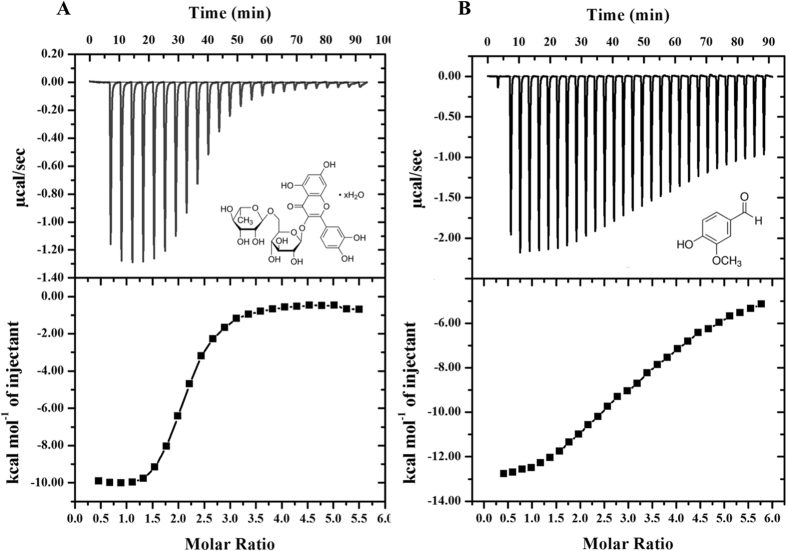
Figure 5.
ITC measurement showing the titration of rutin and vanillin with MARK4. (Top) Raw data plot of heat produced against time for the titration of 800–1200 µM rutin and vanillin into 14–20 µM MARK4. (Bottom) Corresponding binding isotherm obtained after integration of peak area and normalization to yield a plot of molar enthalpy change against rutin/vanillin-MARK4 ratio. The two-site fit curve is displayed as a thin line. Experiments were done in duplicate.

