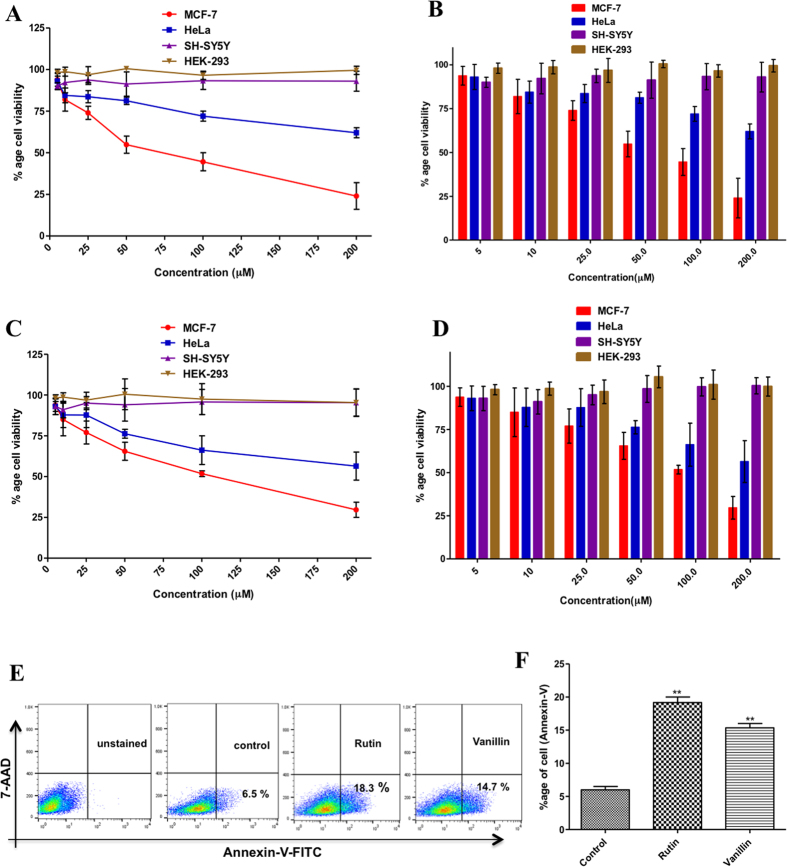
Figure 6.
Cell proliferation, viability and apoptosis studies. (A–D) Effect of rutin and vanillin on the viability of different cancer and normal cell lines: Cells were treated with increasing concentrations of rutin and vanillin (0–200 μM) for 48 h. Cell viabilities were shown as a percentage of the number of viable cells to that of the control. Values > 100 shows the percentage increase in cell survival to that of control (untreated cells). Each data point shown is the mean ± SD from n = 3. (E) Annexin-V staining of MCF-7 cells; cells were treated with IC50 concentrations of rutin (80 μM) and vanillin (120 μM) for 48 h and subsequently stained with FITC-Annexin-V. Stimulation of apoptosis was quantified by flow cytometry. Representative flow images showing FITC-Annexin-V labeled cells, which directly corresponds to the percentage of apoptotic cells. (F) Bar graphs represents the percentage of apoptotic MCF-7 cells stained with Annexin-V for duplicate measurements ± SD. **p < 0.001, compared with the control (untreated cells). Statistical analysis was done using one-way ANOVA and t-test for unpaired samples. For anticancer activities doxorubicin has been taken as positive control.

