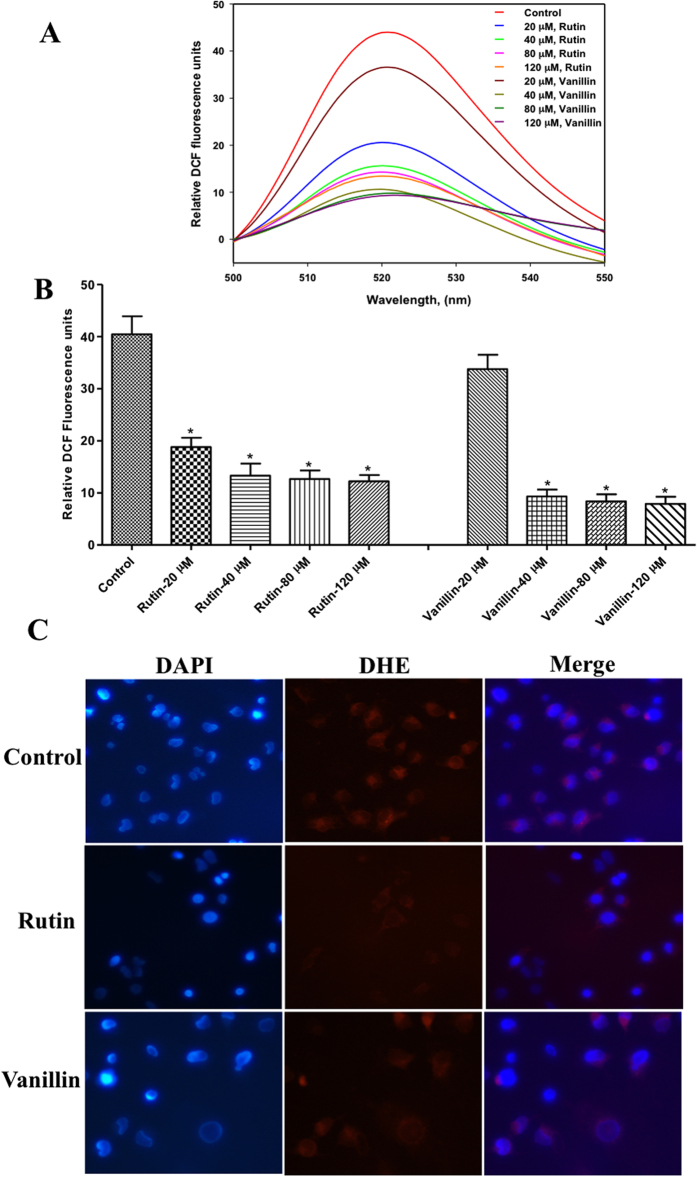
Figure 7.
Effect of rutin and vanillin on the production of ROS. (A) Fluorescence emission spectrum of DCF probe, MCF-7 cells was treated with increasing concentrations of rutin and vanillin. Stained with DCFDA dye and DCF fluorescence was measured by spectroflourimeter. (B) Bar graph presentation of DCF fluorescence with respective treatment. Bar graph represents the relative intensity of DCF fluorescence for duplicate measurements ± SD. *p < 0.05, compared with the control (untreated cells). Statistical analysis was done using one-way ANOVA and t-test for unpaired samples. (C) Representative images of MCF-7 cells stained with DHE for the assessment of cytoplasmic superoxide levels after the treatment of rutin (IC50 = 80 μM) and vanillin (IC50 = 120 μM). After the incubation of cells with rutin and vanillin they were subsequently stained with DAPI and DHE as labeled. Red fluorescence shows the presence of superoxides and intensity of red colour represents the levels of superoxides.

