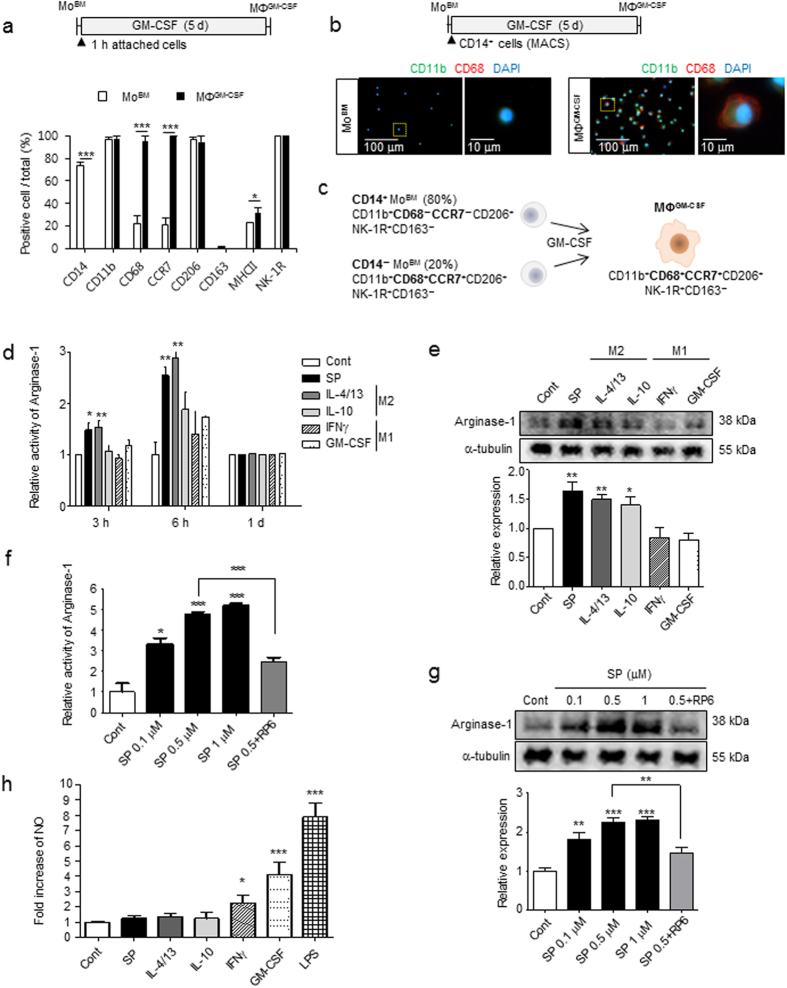
Figure 1.
SP induces M2 polarization through early induction of Arginase-1. (a) MoBM were collected after 1-h of attachment and differentiated into MΦGM-CSF by GM-CSF treatment for 5 d. MΦGM-CSF (CD14−CD11b+CD68+CCR7+CD206+) were defined as M1-like precursors that were differentiated from MoBM (CD14+CD11b+CD68−CCR7−CD206+). For the immunofluorescence staining results (Supplementary Fig. 1a), the number of positive-cells was counted (5 random fields/coverslip) at 100 × magnification (0.85 mm2) (n = 3). (b) CD14+ MACS-isolated monocytes were differentiated with GM-CSF treatment for 5 d, and cells were further characterized as CD11b+CD68+ macrophages. (Green = CD11b, Red = CD68, Blue = DAPI) (n = 3). (c) Proposed model for MΦGM-CSF from MoBM with 80% CD14+ and 20% CD14− phenotypes. (d) Increased Arginase-1 activity was detected at the indicated time point of SP treatment using the Arginase-1 activity assay, and the results were compared with typical M1/M2-inducing cytokines (n = 3). (e) The increased expression of Arginase-1 was detected after 6 h of SP treatment. The western blot samples derived from the same experiment and were quantified with ImageJ. Full-length blots are presented in Supplementary Figure 16a (n = 4). (f–g) Dose-dependent increased activity and expression of Arginase-1 determined after 6 h of SP treatment. This was completely blocked by pretreatment with the NK-1R antagonist RP67580 (1 μM). (f) Arginase-1 activity assay (n = 3). (g) The western blot samples derived from the same experiment and were quantified with ImageJ. Full-length blots are presented in Supplementary Figure 16b (n = 4). (h) Increased NO was detected in culture with IFNγ, GM-CSF, or LPS but not with SP, IL-4/13, or IL-10. Quantitative analysis of NO production was performed in conditioned medium from MΦGM-CSF that had been treated with SP or cytokines for 1 d. LPS treatment served as a positive control (n = 6). Data represent the mean ± SEM (*p < 0.05, **p < 0.01, ***p < 0.001, unpaired t test). Scale bar = 100 μm (b) and 10 μm (high-magnification image of inset in b).

