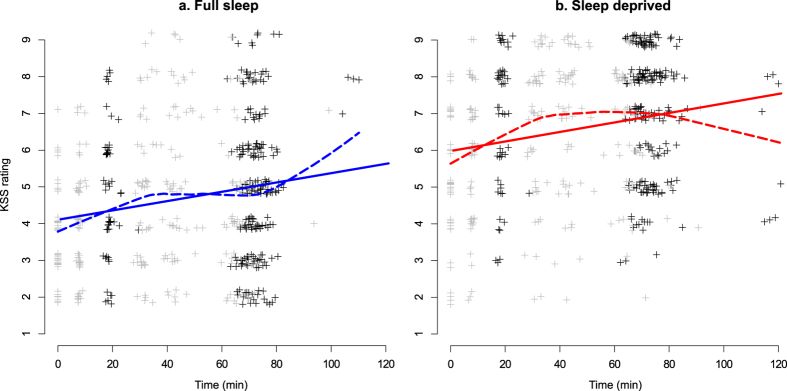
Figure 1.
KSS ratings. Left: Full sleep condition. Right: Sleep deprivation condition. Data have been vertically jittered to aid visualisation. Points in black show KSS ratings made in connection to resting state experiments, and points in gray show other KSS ratings. Straight lines show linear regressions; dashed lines show loess regressions, for visualisation. In most cases, imaging was completed within 90 minutes and data points occurring later are mostly due to technical or other interruptions in the experiment, with participants exiting the MRI scanner and entering again.

