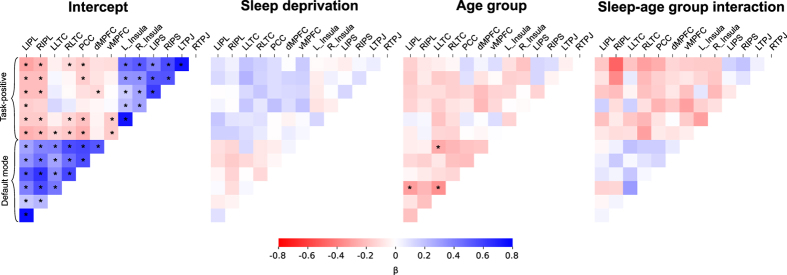
Figure 5.
Connectivity results between regions of interest (ROI) in the default mode network and the task-positive network. Associations between time courses from each ROI were determined for each run and entered into a mixed-effects model. Thus, the intercept represents the overall association between nodes; sleep deprivation represents the main effect of sleep deprivation vs full sleep; age group represents the main effect of older vs younger age group membership; and the sleep-age group interaction represents the interaction effect of sleep deprivation and older age. β is the standardized regression coefficient. False discovery rate correction was performed within each of the four sets of comparisons, and node pairs where p FDR < 0.05 are indicated with an asterisk (*).

