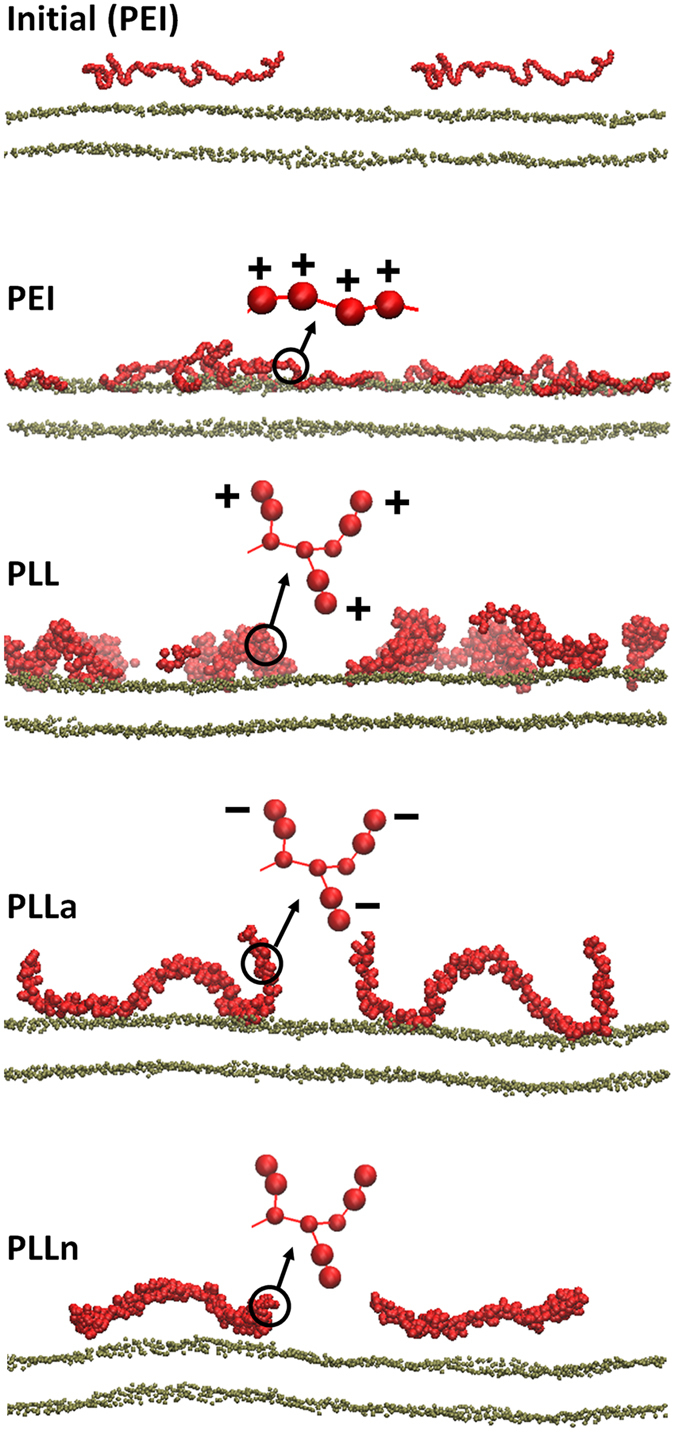
Figure 5.

Snapshots of the side view at the beginning (0 ns; top) and the end (400 ns; rows 2–5) of the simulations. The initial configuration is shown only for PEI, but for other systems, the polymer chains are also similarly distributed above the bilayer surface. Red and brown colors represent polymers and lipid phosphates, respectively. Schematic structures of polymers are shown with charges, whereas lipid tails, water, and counter ions (Na+ or Cl−) are omitted for clarity. Note that the side views show only one cross-section of the system and cannot capture all eight polymer chains. The images were created using Visual Molecular Dynamics25.
