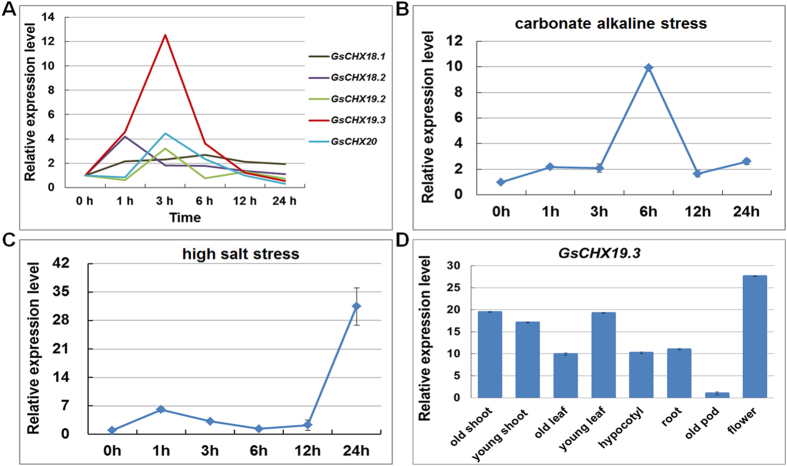
Figure 4.
Expression analysis of GsCHX19.3. (A) Relative expression levels of five GsCHXs from Group IVa based on our previous RNA-seq data. (B,C) qRT-PCR results showing expression levels of GsCHX19.3 under carbonate alkaline and high salt stress in G. soja roots. (D) Expression levels of GsCHX19.3 in different tissues and organs in G. soja. Relative transcript levels were determined by qRT-PCR analysis with GsGAPDH (accession: KN656371.1) as an internal control. The mean values from three fully independent biological repeats and three technical repeats are shown.

