Figure 3.
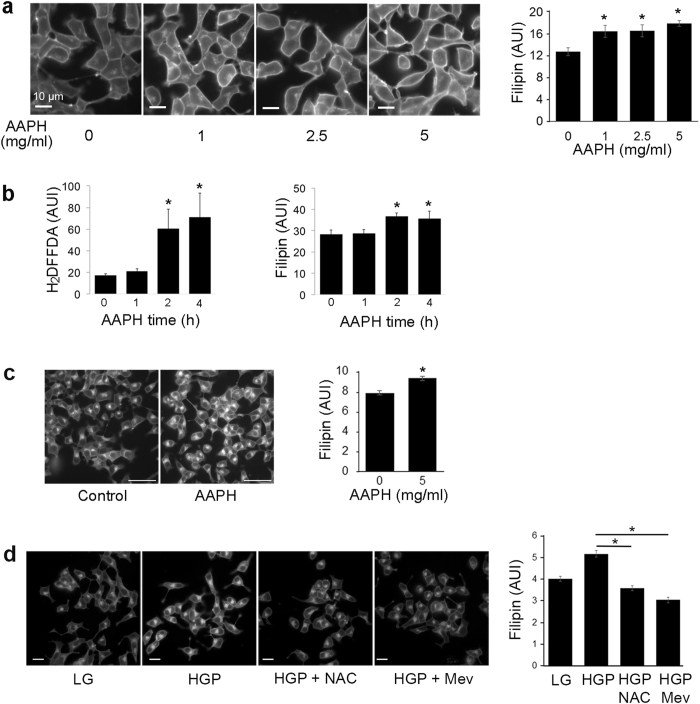
ROS induces cholesterol accumulation. (a) INS-1 cells were treated with AAPH in concentrations from 0 to 5 mg/ml for 4 h in serum-free media. Free cholesterol was measured using filipin. *p < 0.05 against control (no AAPH). Scale bars, 10 μm. (b) INS-1 cells were treated with 2.5 mg/ml AAPH for the different periods of time. Cellular staining of carboxy-H2DFFDA for ROS content and filipin for free cholesterol content was quantified. *p < 0.05 against control (no treatment). (c) Filipin staining of INS-1 cells incubated for 1 h with 5 mg/ml AAPH in serum free media. Scale bars, 50 μm. Filipin intensity per cell was quantified. *p < 0.05. (d) INS-1 cells were treated with LG, HGP, HGP + NAC (0.5 mM), or HGP + Mev for 48 h. Cells were imaged with filipin to measure free cholesterol. Scale bars, 20 μm. *p < 0.05 against HGP.

