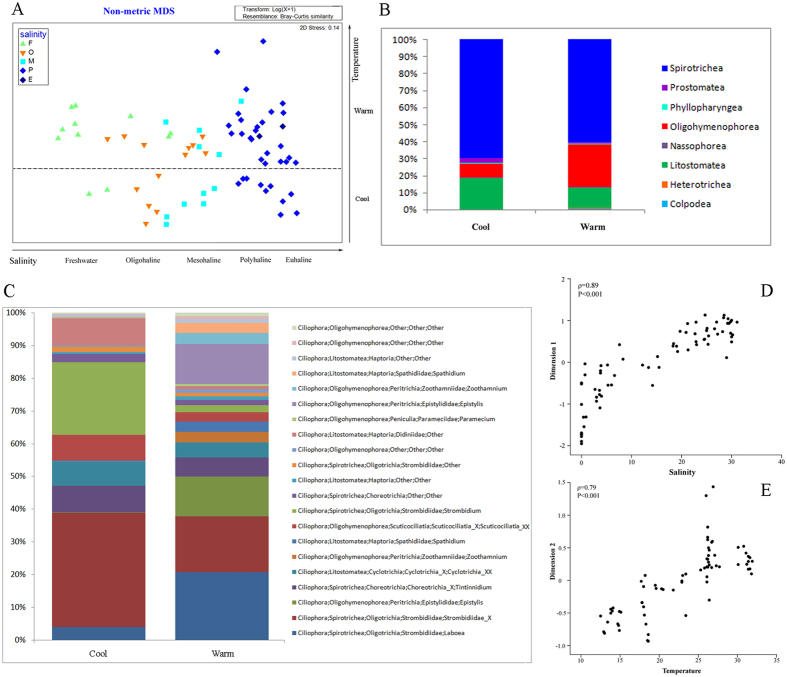
Figure 1.
(A) Plot of non-metric multidimensional scaling based on Bray-Curtis distance matrix, showing pattern of beta diversity for all samples. Note that samples in the cool group were well confined to different salinity zones in contrast to the pattern seen in the warm group. (B,C) Assemblage compositions of the two seasonal groups at class and genus/species level, respectively. (D,E) Correlations of Dimension 1 with salinity, and Dimension 2 with temperature from Fig. 1a, respectively. Spearman’s rho values of 0.89 (P < 0.001) and 0.79 (P < 0.001) indicate strong relationships between salinity/temperature and community variation.

