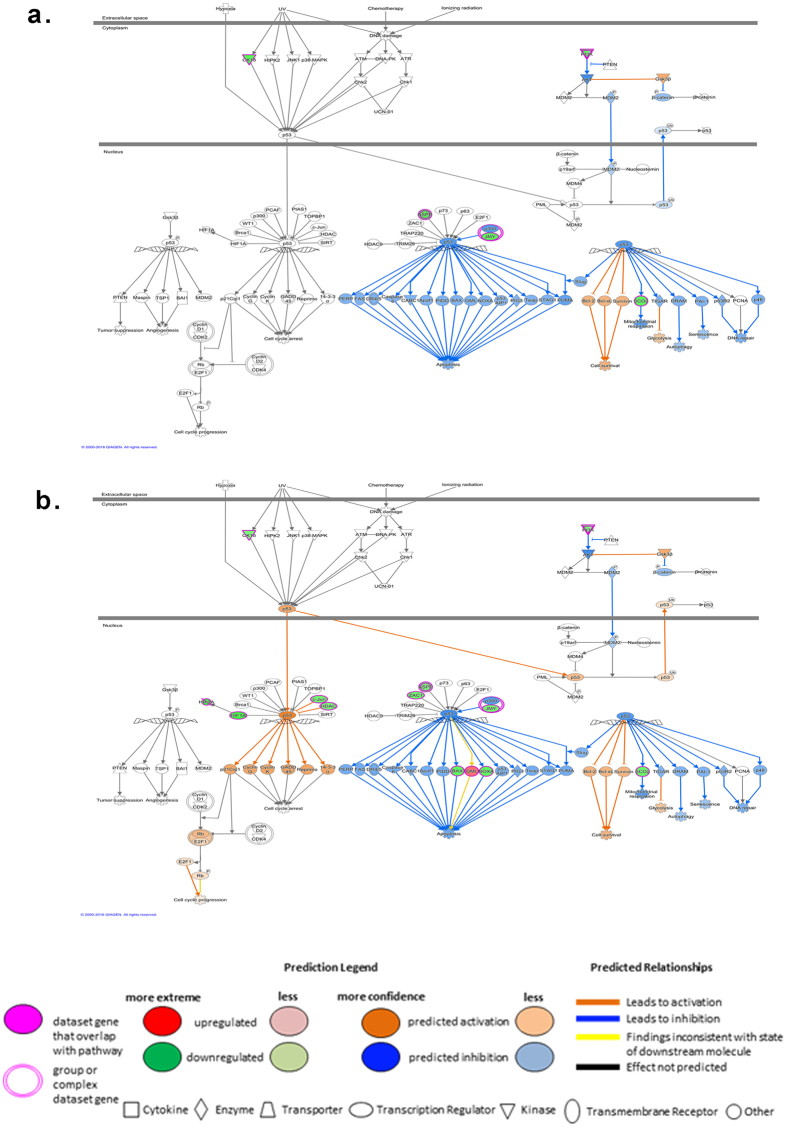
Figure 4.
Diagram of P53 signaling pathway with overlaid molecular activity prediction after heat stress. Diagram of canonical P53 signaling pathway showing up (red) and down (green) regulated genes immediately after heat stress (T1) (a), and one hour after heat stress (T2) (b) along with predictions on biological function. Cell survival and glycolysis (colored orange) are predicted to be increased, while apoptosis, autophagy, senescence, DNA repair, and mitochondrial respiration (colored blue) are predicted to be decreased at both time points. Cell cycle progression is predicted to be increased at T2 only after heat stress (b). The pathway and the molecular activity prediction analyses were generated through the use of QIAGEN’s Ingenuity Pathway Analysis (IPA®, QIAGEN Redwood City, www.qiagen.com/ingenuity).

