
Figure 1.
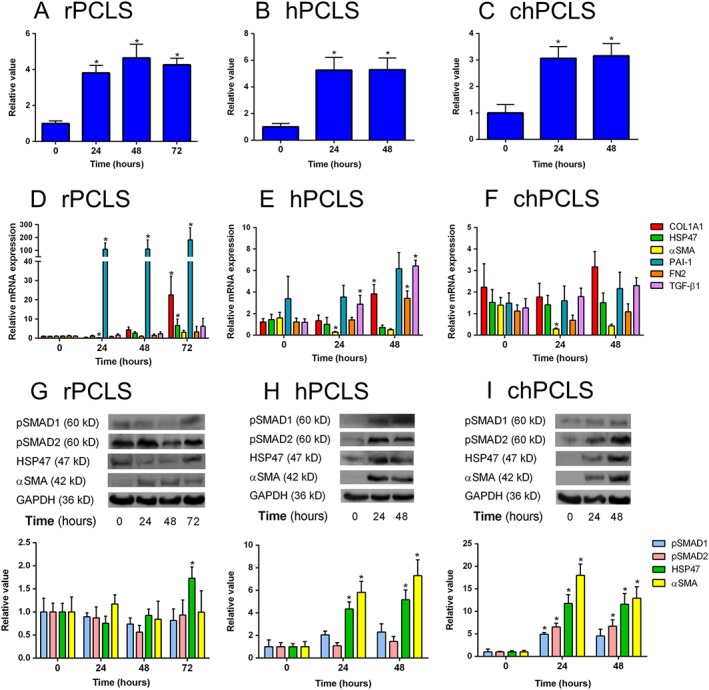
General features of PCLS during incubation. (A–C) ATP level/protein, (D–F) gene and (G–I) protein expression of r(rat)PCLS (A, D, G; n = 5–6 per group), h(human)PCLS (B, E, H; n = 4–8 per group) and ch(cirrhotic human)PCLS (C, F, I; n = 3–6 per group) respectively. *P < 0.05, significantly different from 0 h. Representative sets of Western blots and average protein expression (means ± SEM) of all experimental groups shown as bar graphs after normalization to GAPDH protein.