
Figure 6.
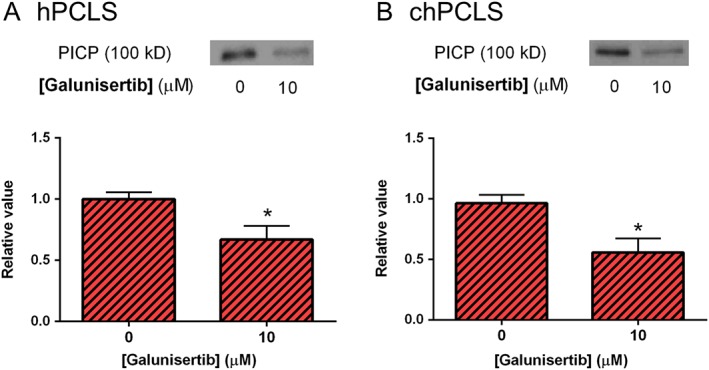
PICP released after treatment with galunisertib for 24 h. (A; n = 5) hPCLS and (B; n = 3) chPCLS. *P < 0.05, significantly different from control. Representative sets of Western blots and average protein expression (means ± SEM) of all experimental groups shown as bar graphs.