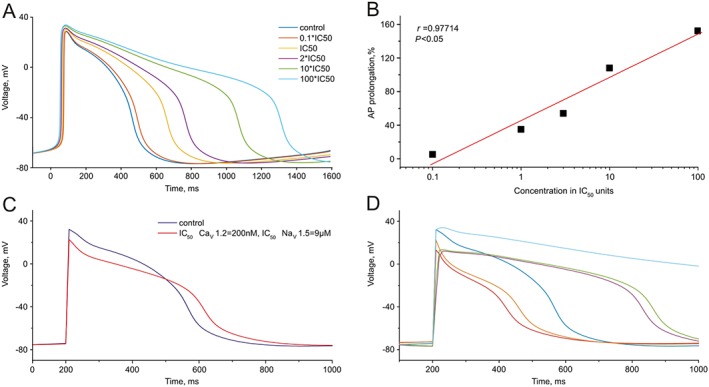
Figure 8.

Simulation of hiPSC‐CM AP at indicated levels of hERG, Cav1.2 and Nav1.5 channel inhibition. (A) Simulation of hiPSC‐CM APs for different levels of selective hERG channel inhibition. (B) Dependence of the calculated APD90 (as % of control) on the concentration of a selective hERG channel inhibitor. (C) Simulated APs at a Dofe45 concentration of 300 nM accounting for hERG inhibition (IC50 = 40 nM) and simultaneous inhibition of Cav1.2 (IC50 = 200 nM) and Nav1.5 (IC50 = 8.9 μM). (D) Comparison of simulated APs at different IC50s of Cav1.2 and Nav1.5 inhibition. Control AP is shown in dark blue and AP for selective hERG channel inhibition (IC50 = 40 nM) in light blue. Red 100 nM (Cav1.2) and 1 μM (Nav1.5), orange 100 nM (Cav1.2) and 10 μM (Nav1.5), magenta 500 nM (Cav1.2) and 1 μM (Nav1.5), green 500 nM (Cav1.2) and 10 μM (Nav1.5). See also Supporting Information Table S1 comparing the values used in silico AP models of adult ventricular myocytes and hiPSC‐CM.
