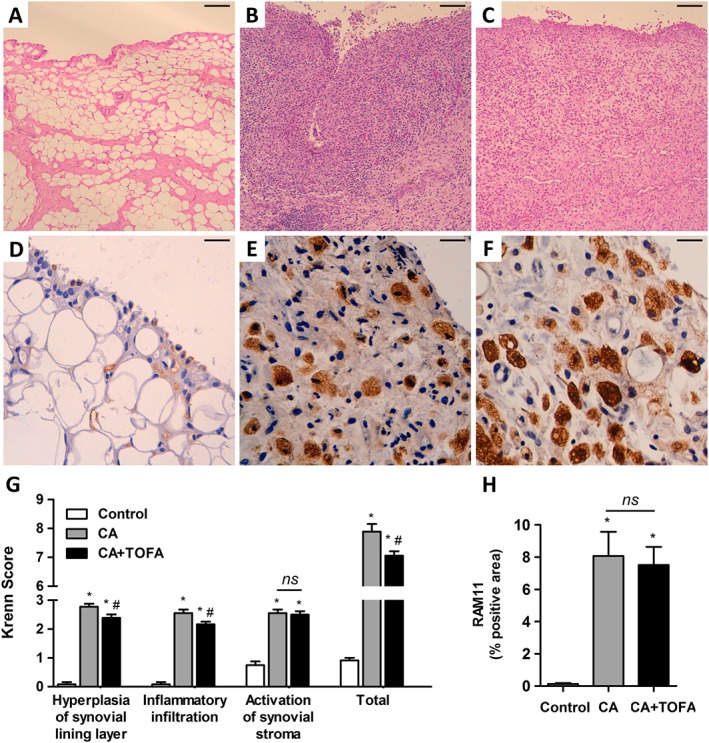
Figure 1.

Assessment of synovitis and macrophage infiltration. (A–C) Representative sections of synovium stained with haematoxylin and eosin. Control (A), CA (B) and CA + TOFA (C). Scale bar = 100 μm. (D–F) Immunohistochemistry of representative sections of synovium using the monoclonal anti‐rabbit macrophage antibody RAM11. Control (D), CA (E) and CA + TOFA (F). Scale bar = 25 μm. (G) Global synovitis score, quantified as described in Methods. Bars show the mean and SEM (n Control = 12 paws, n CA = 18 paws and n CA+TOFA = 18 paws). Mann–Whitney test, *P < 0.05 versus Control, #P < 0.05 versus CA, ns = non‐significant. (H) Densitometric analysis of RAM11 staining as a percentage in the synovium of each group of animals. Bars show the mean and SEM (n Control = 12 paws, n CA = 18 paws and n CA+TOFA = 18 paws). Mann–Whitney test; *P < 0.05 versus Control, ns = non‐significant.
