
Figure 5.
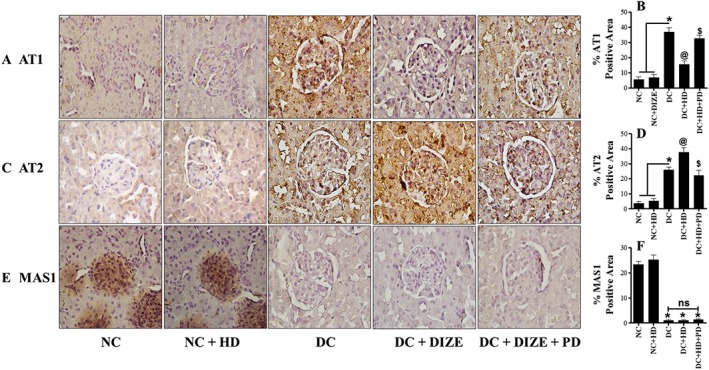
Renal expression of AT1, AT2 and MAS1 receptor proteins. (A, C, E) Immunohistochemical staining of AT1, AT2 and MAS1 receptors in kidney sections and (B, D, F) their respective semi‐quantitative analysis using ImageJ software. Values shown are means ± SEM. n = 25. * P < 0.05, significantly different from NC and NC + HD, @ P < 0.05 significantly different from DC. $ P < 0.05, significantly different from DC + HD. ns, not significant.