Figure 1.

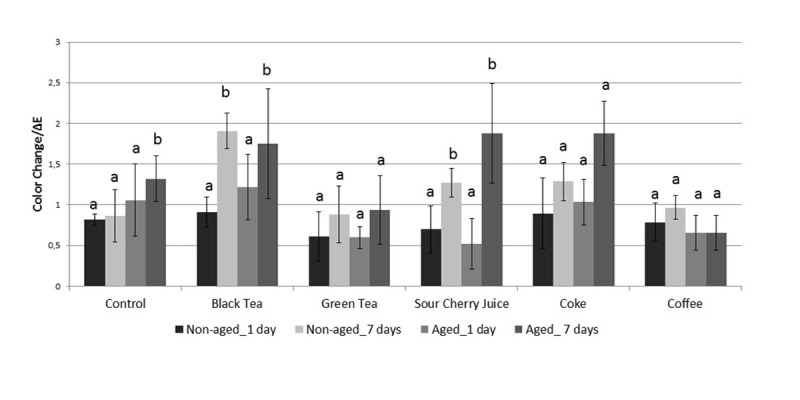
Bar graphic representation of the mean color difference values (ΔE) with standard deviations (SD). The same lower letter indicates no significant difference among the subgroups stored in the same drink solution (p>0.05).

Bar graphic representation of the mean color difference values (ΔE) with standard deviations (SD). The same lower letter indicates no significant difference among the subgroups stored in the same drink solution (p>0.05).