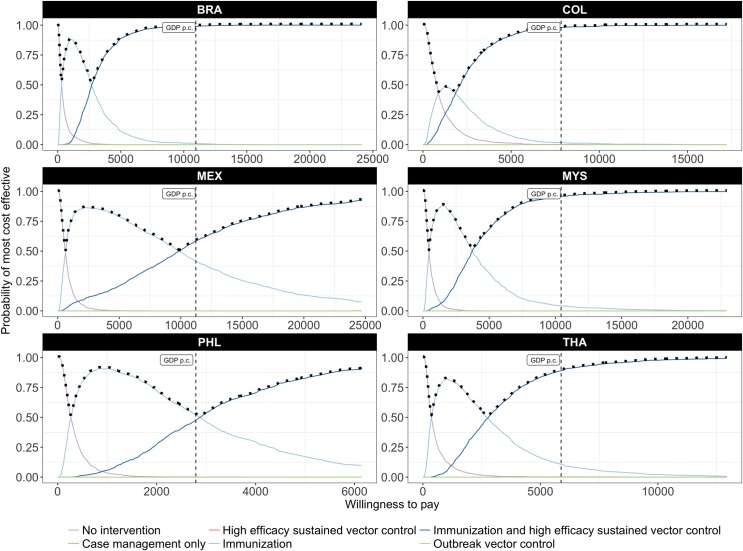
Fig 4. Probability of being most cost-effective at any given threshold, considering high-efficacy sustained vector control and a highly targeted, low-cost immunization strategy.
The solid lines are cost-effectiveness acceptability curves (CEACs) representing the probability that an intervention is cost-effective at a given threshold; the (vertical) dashed line indicates the probability that an intervention is cost-effective at a threshold equal to GDP per capita; the dotted line represents the cost-effectiveness acceptability frontier (CEAF) which represents the probability that the most cost-effective option is cost-effective at a given threshold.

