Figure 3.

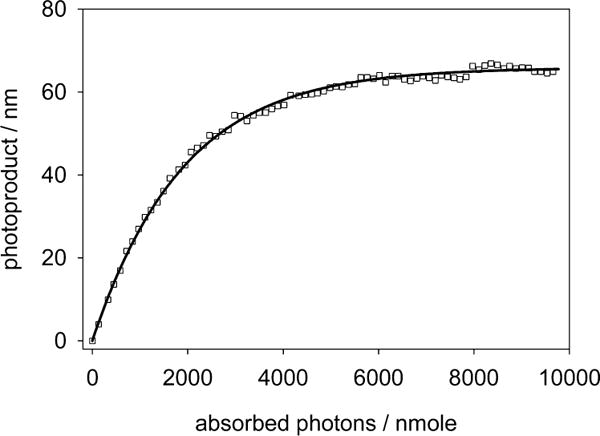
Progression of the UV-vis spectra during a photolysis reaction against absorbed photons. The continuous line is the theoretical fit according to eq 1. The initial slope of the curve represents the quantum yield ϕPD = 0.034.

Progression of the UV-vis spectra during a photolysis reaction against absorbed photons. The continuous line is the theoretical fit according to eq 1. The initial slope of the curve represents the quantum yield ϕPD = 0.034.