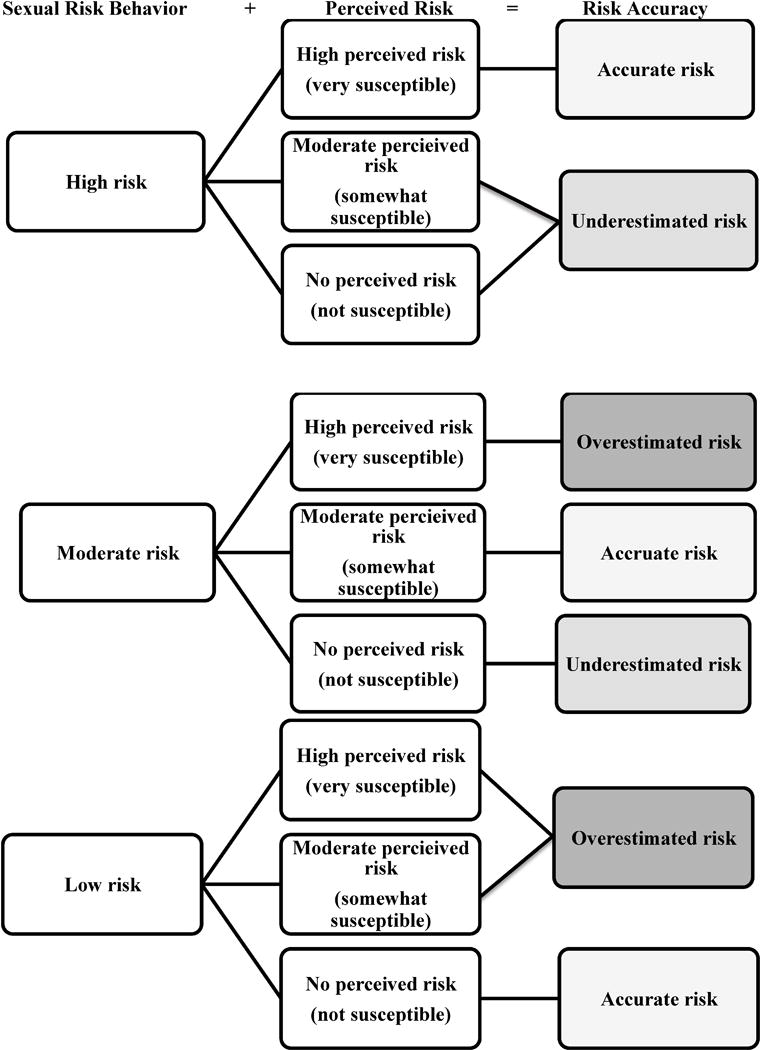
Figure 1.

A model of sexual risk accuracy. This figure represents potential in/accuracy categories when comparing perceived and actual sexual risk among older adults. Sexual risk behavior groups were created based on stratifying frequencies of sexual risk behaviors by three equal percentages (i.e. tertiles), resulting in high (15+ behaviors), moderate (2–14 behaviors), and low (0–1 behaviors) groups. Perceived risk groups were created based on grouping Likert responses to the perceived risk item—very susceptible (5–6), somewhat susceptible (2–4), and not susceptible (1). Based on similar groupings from Kershaw et al., 2013.
