
Figure 12.
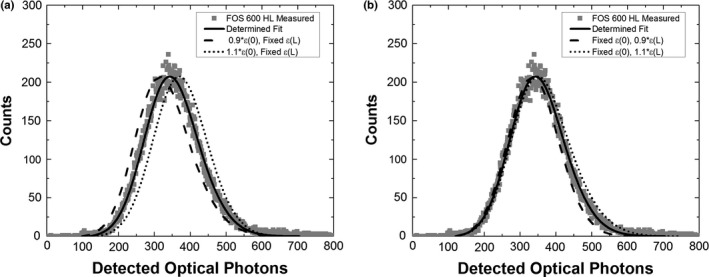
(a) Comparison of a measured PHS (FOS 600 HL #bib25 keV) and calculated PHS when is varied by ± 10% of its estimated value. Agreement between the modeled and measured PHS is strongly affected by , which shifts the position of the modeled PHS peak. (b) PHS calculated when is fixed and varied by ± 10%. Agreement between the modeled and measured PHS is less sensitive to changes in , which primarily affect the upper PHS tail.