
Figure 2.
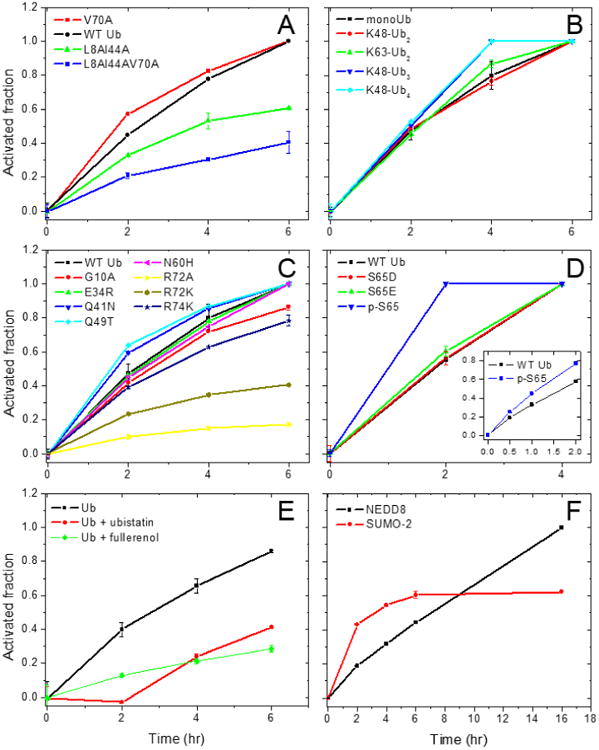
Comparison of the time course of activation of Ub, its mutants, and the UBLs by cognate E1 enzymes. Shown is the activated fraction of each protein as a function of time for (A) hydrophobic patch mutants of Ub, (B) mono- and polyUb, (C) other Ub mutants studied here, (D) p-S65 Ub and its phosphomimics, (E) Ub in the presence of ubistatin A or fullerenol, and (F) NEDD8 and SUMO-2. The inset in D shows the activation of p-S65-Ub and UbWT measured at earlier time points (0, 0.5, 1, and 2 hr). See also Figures S11-S12.