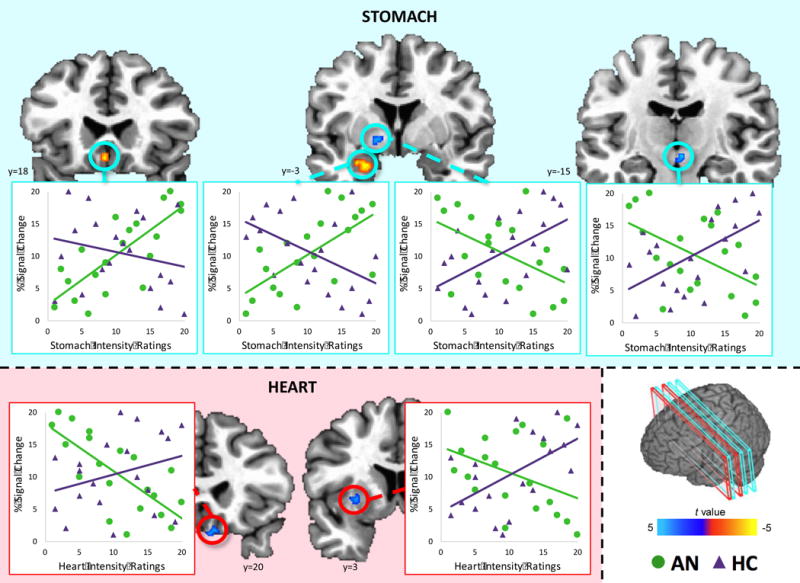
Figure 3. Relationship between interoceptive sensation ratings and activation in response to high palatability food images compared to low palatability food images.

AN participants (green) exhibited a positive relationship between stomach sensation intensity ratings and activation in response to high palatability foods in the subgenual anterior cingulate cortex and amygdala, while HC participants (purple) exhibited a negative relationship in these regions. In contrast, AN was associated with a negative relationship between stomach sensation intensity ratings and activation in the ventral pallidum and ventral tegmental area, while HC participants displayed the opposite pattern. Scatterplot data are within-group ranked values and provided for visualization purposes only. Coordinates are in Talairach space.
