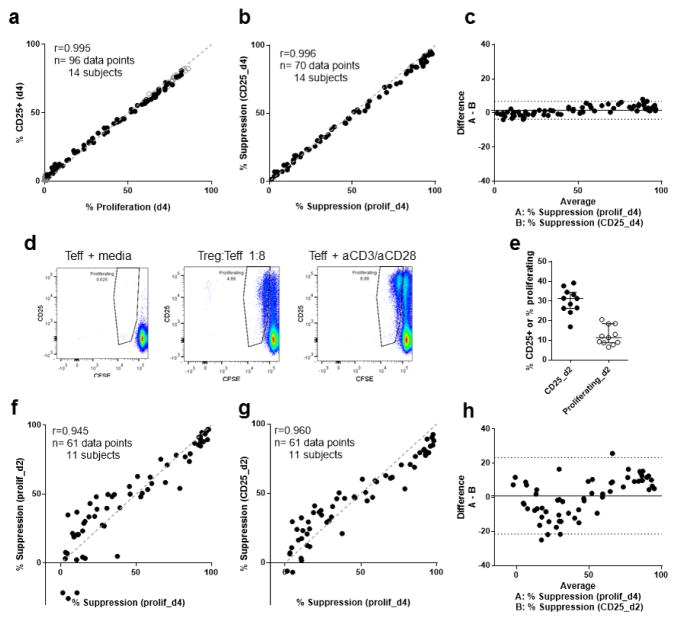
Figure 1. Suppression of CD25 Teff surface expression correlates with suppression of Teff proliferation.
(a) Correlation of CD25 surface expression on Teff and CFSE-based Teff proliferation at day 4. (b) Correlation of percentage suppression of CD25+ Teff and percentage suppression of CFSE-based Teff proliferation at day 4. (c) Bland-Altman plot of percentage suppression of CD25 surface expression on Teff and percentage suppression of CFSE-based Teff proliferation at day 4. (d) For one representative individual, the dilution of CFSE through cell division and expression of CD25 on Teff are shown for day 2. (e) CD25 surface expression and CFSE-based proliferation on day 2 from Teff cultured with anti-CD3/anti-CD28 beads alone. (f) Correlation of percentage suppression of CFSE-based Teff proliferation at days 2 and 4. (g) Correlation of percentage suppression of CD25+ Teff at day 2 and percentage suppression of CFSE-based Teff proliferation at day 4. (h) Bland-Altman plot of percentage suppression of CD25+ Teff at day 2 and percentage suppression of CFSE-based Teff proliferation at day 4. For day 4 (a–c), 96 data points representing different Treg:Teff ratios for 14 healthy controls are shown (7 experiments with no replicated samples). From the same experiments on day 2 (e–h), 70 data points from 11 of 14 healthy controls due to low cell numbers from three participants. Spearman’s rank correlation coefficient: a (r=0.995, P<0.0001), b (r=0.996, P<0.0001), f (r=0.945, P<0.0001), and g (r=0.960, P<0.0001); dashed line shows y=x, solid circles show Teff+Treg, and open circles in a show Teff alone. Bland-Altman analysis was used to compare methods in c (bias=1.6%) and h (bias= 0.9%). The solid line shows average bias, dotted lines 95% CI for agreement. No statistical comparison was made for (e), median and interquartile range are shown.

