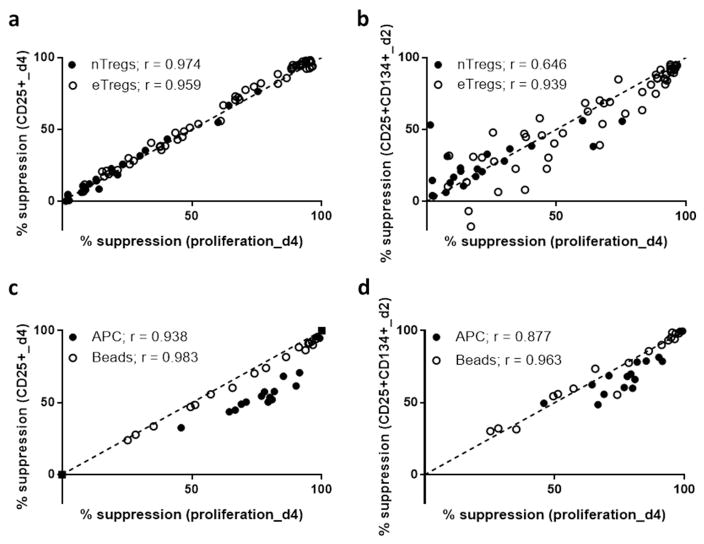
Figure 3. Surface marker-based suppression assay correlates with proliferation-based suppression assay when using nTregs or APC activation.
(a) Correlation of percentage suppression of CD25+ Teff at day 4 and percentage suppression of CFSE-based Teff proliferation at day 4; solid circles = nTregs, and open circles = eTregs. (b) Correlation of percentage suppression of CD25+CD134+ Teff at day 2 and percentage suppression of CFSE-based Teff proliferation at day 4; solid circles = nTregs, and open circles = eTregs. The median frequency of CD25+CD134+ on day 2 in Teff cultured without Treg suppression was 20% (range 7–22%). (c) Correlation of percentage suppression of CD25+ Teff at day 2 and percentage suppression of CFSE-based Teff proliferation at day 4; solid circles = APC activation, and open circles = Bead activation. (d) Correlation of percentage suppression of CD25+CD134+ Teff at day 2 and percentage suppression of CFSE-based Teff proliferation at day 4; solid circles = APC activation, and open circles = Bead activation. Spearman’s rank correlation coefficients: a (nTregs: r= 0.974, p<0.0001 eTregs: r=0.959, p<0.0001), b (nTregs: r= 0.646, p=0.0016 eTregs: r=0.939, p<0.0001), c (APC: r= 0.938, p<0.0001 Beads: r=0.983, p<0.0001), d (APC: r= 0.877, p<0.0001 Beads: r=0.963, p<0.001). nTregs were sorted from two subjects, eTregs were expanded from three subjects, and grouped for analysis, and Teff were from six subjects.

