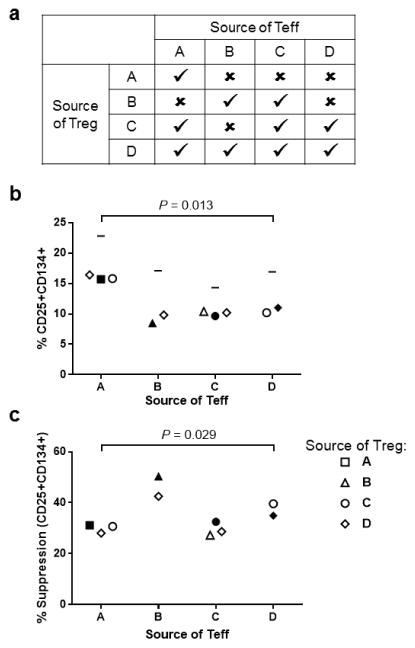
Figure 5. Measurement of suppression of CD25+CD134+ expression on day 2 using 5,000 Teff per well.
(a) Outline of the source of Tregs and Teff from four donors (A, B, C and D). Cells were combined in four autologous and six allogenic pairings depending on number of cells recovered from sorting. (b) Percentage CD25+CD134+ Teff at a 1:4 ratio of Tregs:Teff. Horizontal line indicates the maximum proliferation for Teff incubated with anti-CD3/anti-CD28 beads without Tregs (not included in Kruskal-Wallis Test). (c) Percentage CD25+CD134+ suppression calculated from the data in Figure B. The median frequency of CD25+CD134+ on day 2 in Teff cultured without Treg suppression was 17% (range 14–23%). For b and c, the x-axis indicates the source of the Teff for the assay. The shape of the symbol indicates the source of Treg: subject A = square, subject B = triangle, subject C = circle, subject D = diamond. Filled symbols indicate cells from the same subject. Kruskal-Wallis Test: (b) P=0.013, and (c) P=0.029.

