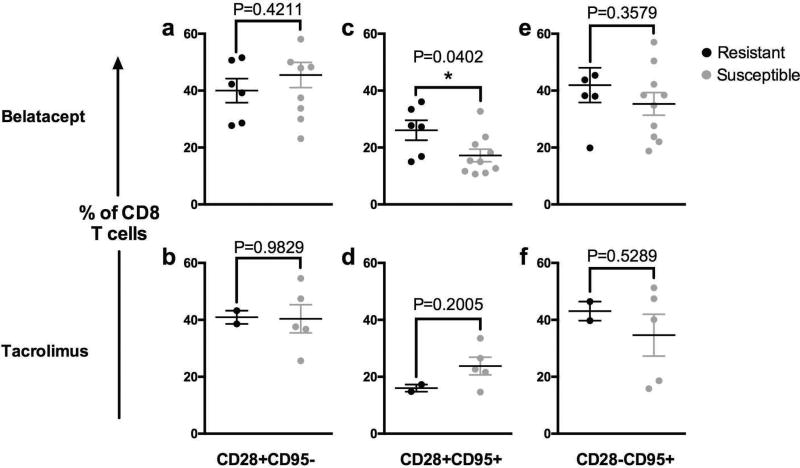
Figure 3. Pre-Transplant Immune Phenotyping with CD28 and CD95.
Prior to transplantation, CD8 T cells were analyzed by CD28 and CD95 expression (top row: belatacept treated animals, bottom row: tacrolimus treated animals). Subsets are expressed as a frequency of total CD8 T cells as follows: (a & b) CD28+CD95 (c & d) CD28+CD95+ and (e & f) CD28CD95+. Mean values of pre-transplant samples from resistant animals (black circles) were compared to those from susceptible animals (grey circles). Only the difference in the frequency of CD28+CD95+CD8+ T cells between resistant and susceptible animals treated with belatacept were significantly different (Figure 3c, P=0.0402).

