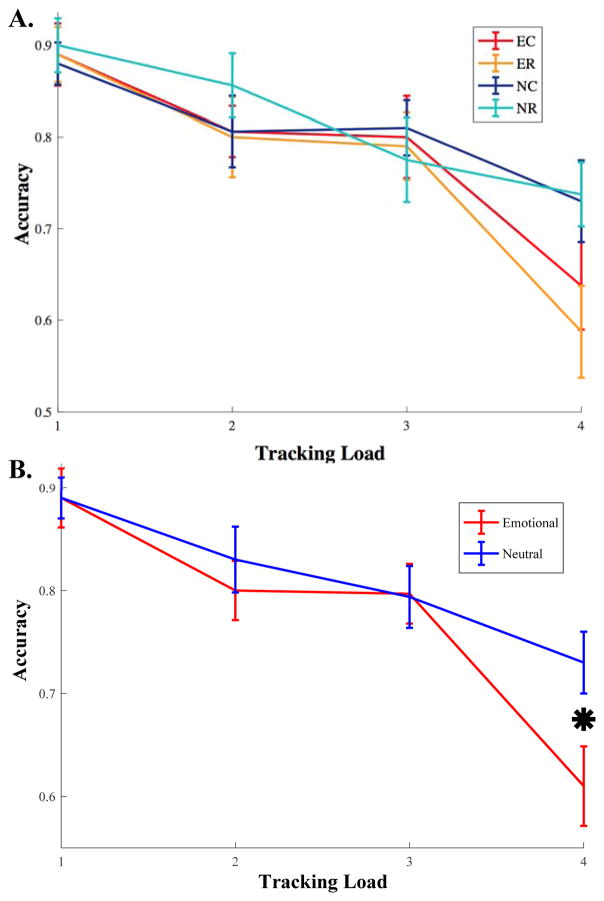
Figure 2.
A) Average tracking accuracy under the four different conditions at each tracking load with standard error of the mean (SE). EC = emotional continuous (red), ER = emotional random (orange), NC = neutral continuous (blue), NR = neutral random (teal). B) Tracking accuracy with SE collapsed across the two different presentation conditions (that is, continuous and random presentations). The asterisk indicates a significant difference in performance between emotionally unpleasant and neutral distraction at the highest tracking load level (corresponding to track-four).

