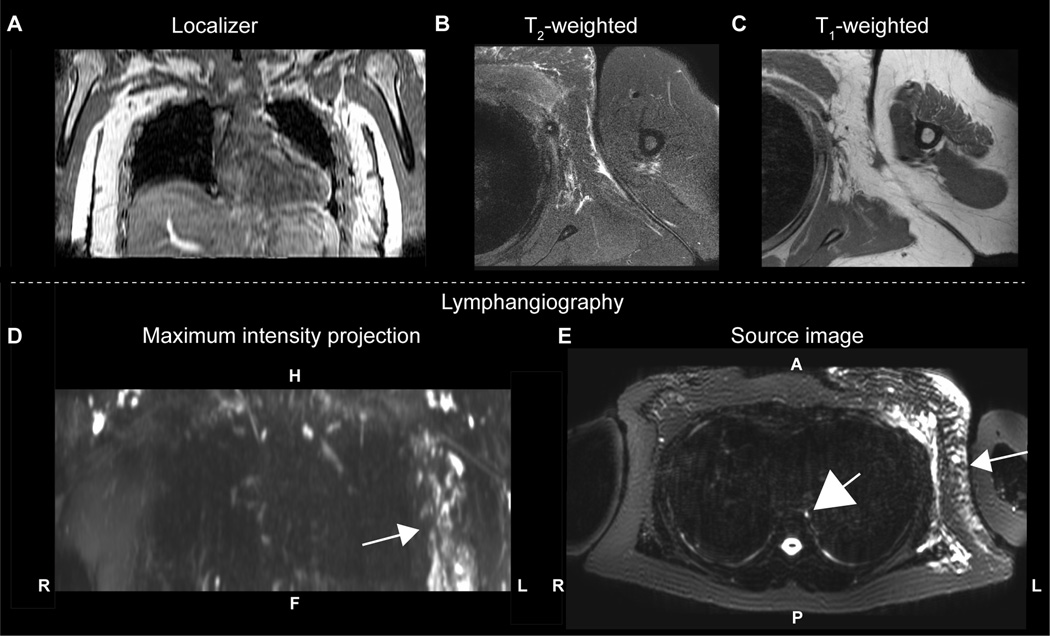
Figure 3.
A 53 year old female with left-sided Stage 1 BCRL (onset < 1 month) imaged at the end of radiation therapy and three months after 17 lymph nodes (all negative for carcinoma) were removed. (A) The T1-weighted localizer shows the region imaged, along with (B) T2-weighted and (C) T1-weighted structural imaging of the involved side. Regions of subcutaneous edema are visible in the T2-weighted scan. A (D) coronal MIP and (E) source image from the lymphangiography scan show contrast asymmetry between affected and contralateral quadrants (white arrows). The thoracic duct (E; large central white arrow) is also clearly visible. Compared with the subcutaneous edema seen in (B), the lymphatic vessels in (D-E) can be traced on continuous slices in a complex matrix of dilated tubes and channels.

