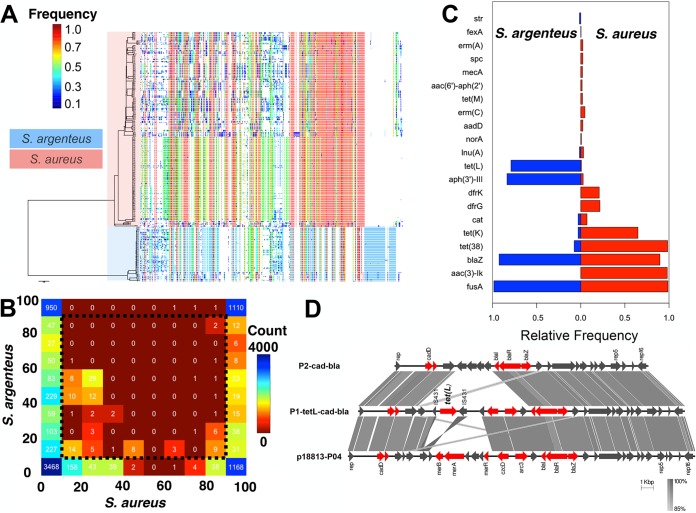
FIG 3 .
(A) Phylogenetic tree based on SNPs in the core genome of S. aureus and S. argenteus and the presence or absence of accessory genes across the genomes. Heatmap colors denote the frequency of each accessory gene across the collection. (B) Comparative pangenome analysis of S. aureus and S. argenteus. The values on each side of the table show the percentages of isolates of that species harboring the gene, and the values within the table are the numbers of genes shared by those isolates. (C) The relative frequency of known antibiotic resistance genes in the S. argenteus and S. aureus populations. (D) Alignment of genomic components of plasmids P1-tetL-cad-bla and P2-cad-bla, and known plasmid p18813-P04.

