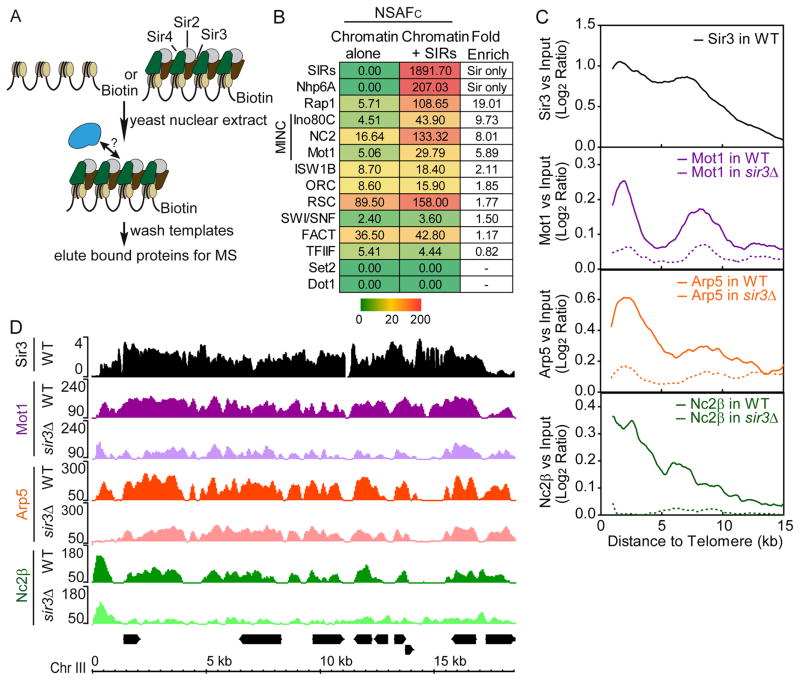
Figure 1.
MINC binds yeast heterochromatin. (A) Schematic of immobilized template procedure. (B) MuDPIT analysis of proteins binding to silent chromatin. Immobilized chromatin templates bearing or lacking Sir2,3,4 were incubated with yeast nuclear extract, washed and subjected to MuDPIT alongside purified Sir2,3,4. The chart shows a heat map depicting the Avg. NSAFC for proteins enriched by the presence of Sir2,3,4. Color scale bar in NSAFC is shown below. (C) Average binding profile of Sir3, Mot1, Arp5 (Ino80C) and Nc2β in subtelomeric regions of wild-type and sir3Δ strains by ChIP-seq. The moving averages of log2 MINC enrichment versus input and the Sir3 log2 ratio versus input (step size = 100 bp, window size = 20) were plotted by the distance from the telomere, from 0 to 15 kb (X-axis). (D) Browser plots of Sir3 and MINC in wild-type and sir3Δ strains by ChIP-seq on Chromosome III subtelomere. Y axis shows the normalized read counts of MINC and log2 ratio of Sir3 versus Input. See Table S1 and 2.

