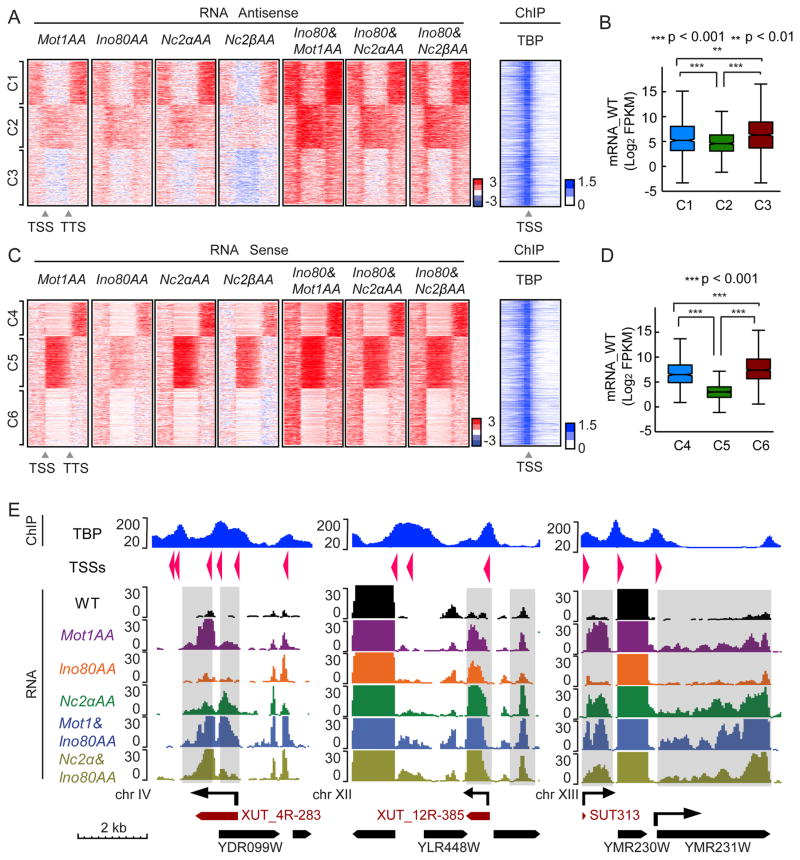
Figure 4.
MINC depletion reveals similar transcriptome effects in S. cerevisiae. (A) Heatmaps indicating change in antisense transcription upon AA depletion of Mot1, Ino80, and NC2 α and β subunits, alongside NC2 and Mot1 in combination with Ino80 versus wild type from 1 kb upstream of TSS to 1 kb downstream of TTS at MINC bound genes. 2746 MINC overlap genes were separated into 3 clusters using k means (C1, 833 genes; C2, 843 genes; C3, 1070 genes). The change is log2 scale; red is upregulated and blue is downregulated RNAs. Heatmap of TBP enrichment (log2 scales of IP vs Input) within 1 kb upstream and downstream of TSS is shown to the right. (B) Boxplot of average WT genic mRNA levels of C1, C2 and C3 with p val significance indicated. (C) Same as A but for sense strand transcription (C4, 652 genes; C5, 1002 genes; C6, 1092 genes). (D) Same as B but for C4, C5 and C6 with p val significance indicated. (E). Browser track showing examples of different RNA effects upon MINC depletion from chromosome IV (upstream and genic antisense), chromosome XII (downstream and genic antisense), and chromosome XIII (upstream sense and genic sense, i.e., silent gene being expressed). TBP ChIP through affected region is shown (Top panel). Y axis shows the normalized read counts and the arrows indicate the direction of transcripts. Known 5′ Cap sites and directions are indicated as arrows in TSSs row. Known genic mRNAs are indicated as black boxed arrows and XUTs and SUTs are indicated as dark red boxed arrows. See Figure S2.

