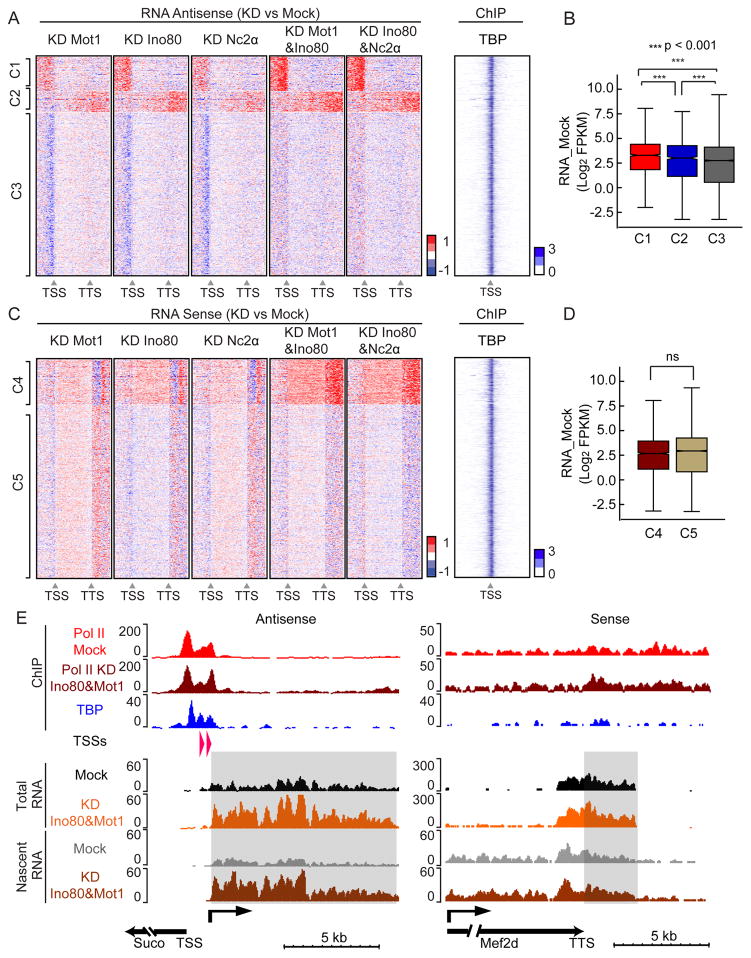
Figure 6.
Depletion reveals similar transcriptome effects of MINC components in murine ESCs. (A) Heatmaps of change in antisense transcription upon depletion of Mot1, Ino80, and Nc2α individually and NC2α and Mot1 in combination with Ino80 versus control from 3 kb upstream of TSS to 3 kb downstream of TTS at MINC-bound genes. Clusters displaying similar transcription patterns under all conditions upstream of TSS and downstream of TTS are termed cluster 1 and 2 (C1, 1906 genes; C2, 1182 genes). All other clusters were merged and randomized as cluster 3 (C3, 9073 genes). Red is upregulated and blue is downregulated. Heatmap of TBP enrichment (log2 of IP vs Input) within 3 kb upstream and downstream of the TSS is shown to the right. (B) Boxplot of average mock genic RNA levels of C1, C2 and C3 with p val significance indicated. (C) Same as A but for sense strand transcription. The cluster with similar transcription patterns in the coding region and downstream of the TTS is termed cluster 4 (C4, 2502 genes). All other clusters were merged, randomized and included in cluster 5 (C5, 9659 genes). Red is upregulated and blue is downregulated RNAs. Heatmap of TBP enrichment is shown to the right. (D) Boxplot of average mock mRNA levels of C4 and C5 genes with p val significance indicated. (E) Browser tracks showing Pol II enrichment in the Mock and Ino80&Mot1 KD above TBP peaks. Representative examples of changes in Total RNA or Nascent RNA at the TSS (Suco) and TTS (Mef2d) upon MINC depletion. Y axis shows the normalized read counts and arrows indicate the direction of transcripts. Known 5′ Cap sites and direction of pervasive RNA are indicated in the TSSs row. Shaded areas represent pervasive transcripts in the antisense direction upstream of the TSS (Suco) and sense direction downstream of the TTS (Mef2d). See Figures S4 and S5.

