Figure 5.

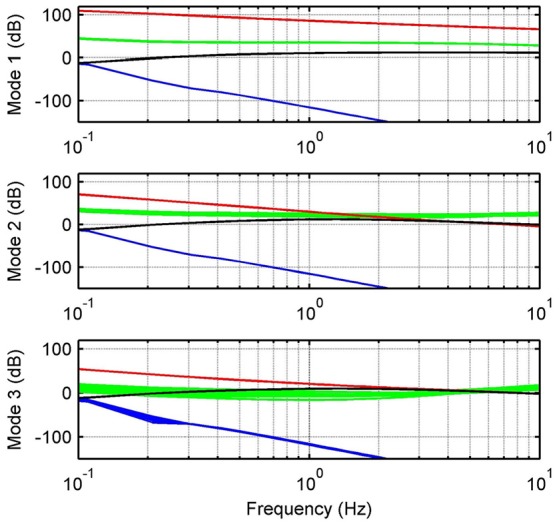
Relative errors and upper bounds. Relative errors between nominal and uncertain models with respect to inputs uk (green) and rk (blue). Graphs also show upper bounds for inputs uk (red) and rk (black).

Relative errors and upper bounds. Relative errors between nominal and uncertain models with respect to inputs uk (green) and rk (blue). Graphs also show upper bounds for inputs uk (red) and rk (black).