Figure 2.
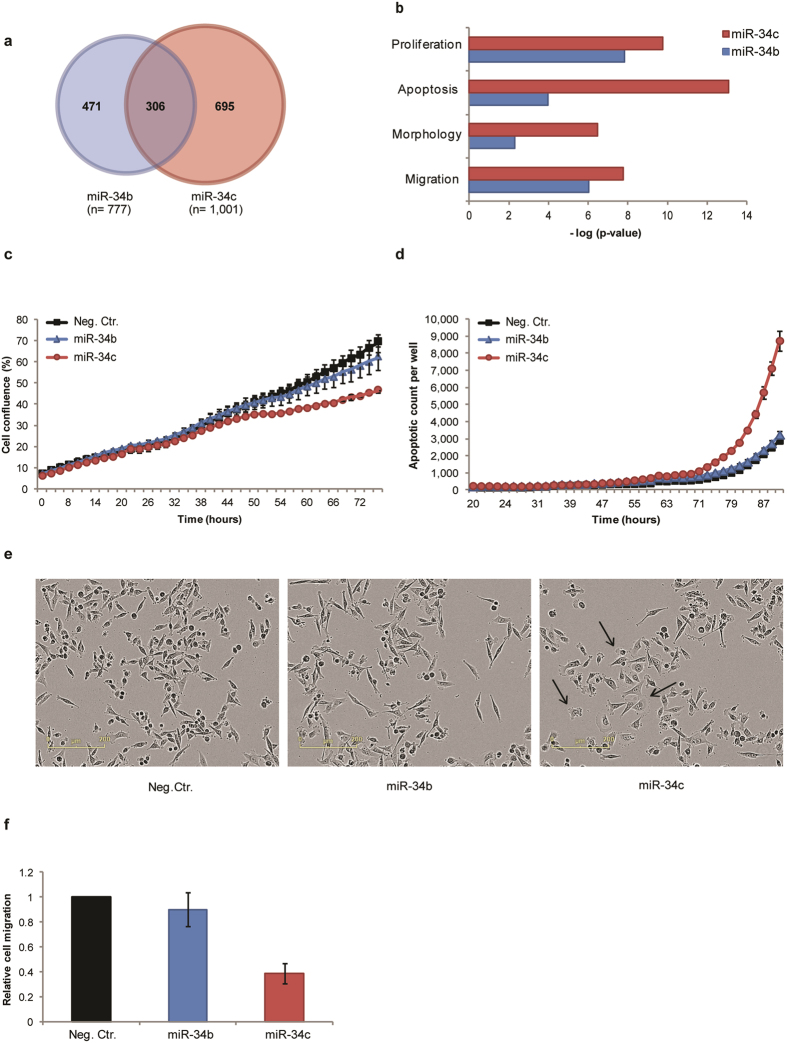
Comparing effects of introducing miR-34b-5p and miR-34c-5p mimics into MDA-MB-231 cells. Cells were transiently transfected with mimics representing miR-34b or miR-34c or a negative control mimic. (a) Venn diagram showing the number of significant differentially expressed transcripts (q ≤ 0.05) 48 h after transfection with miR-34 mimics. (b) Enriched biological processes based on transcript level changes following introduction of miR-34b (blue bars) or miR-34c (red bars), as determined by Ingenuity Pathway Analysis. (c) Cellular growth rate is shown as cell density versus time. One representative experiment is shown (n = 7). Error bars represent standard error of mean (SEM) for technical triplets. (d) Apoptosis is shown as number of caspase 3/7-positive cells per well versus time. One representative experiment is shown (n = 5). Error bars represent SEM for technical triplets. (e) Phase-contrast images of cells 72 hours after introduction of mimics, magnification 10x. The arrow indicates cells with changed morphology in miR-34c transfected cells. (f) The migratory capacity of the transfected cells was determined using a transwell pore assay (n = 2). Data is shown relative to control-transfected cells. Error bars represent SEM for biological experiments.

