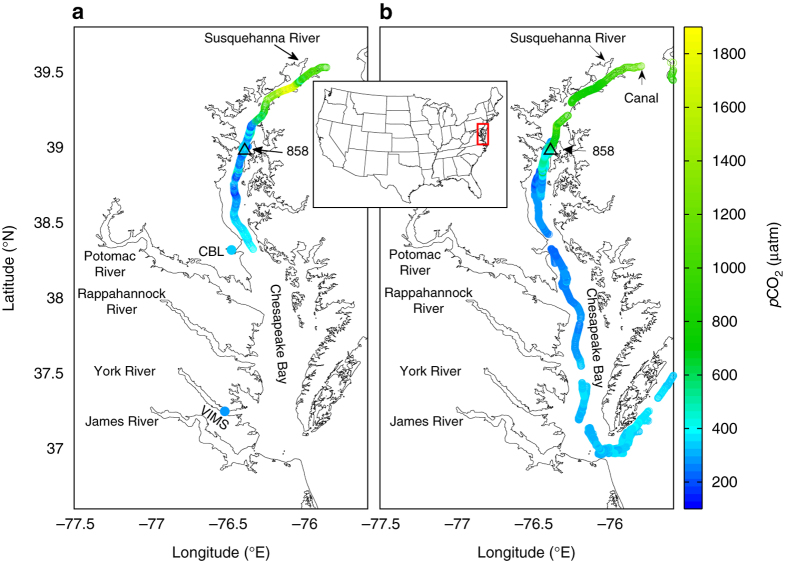
Fig. 1.
Measured surface water pCO2 overlapped on a site map of the Chesapeake Bay. a 8–15 August 2013 and b 11–16 April 2015. Data were collected underway aboard R/V Sharp and supplemented with dockside measurements at the Chesapeake Biological Laboratory (CBL) and Virginia Institute of Marine Science (VIMS) during the August cruise. The inserted map shows the general location of the bay. Station 858 is our focused study site. The cruise average of atmospheric and surface water pCO2 values and monthly wind speed are given in Table 1. The pCO2 range was 340–590 µatm near CBL and 290–550 µatm near VIMS, with the lower ends represent incoming bay water during high tides and the high ends representing outgoing sub-estuarine waters during low tides

