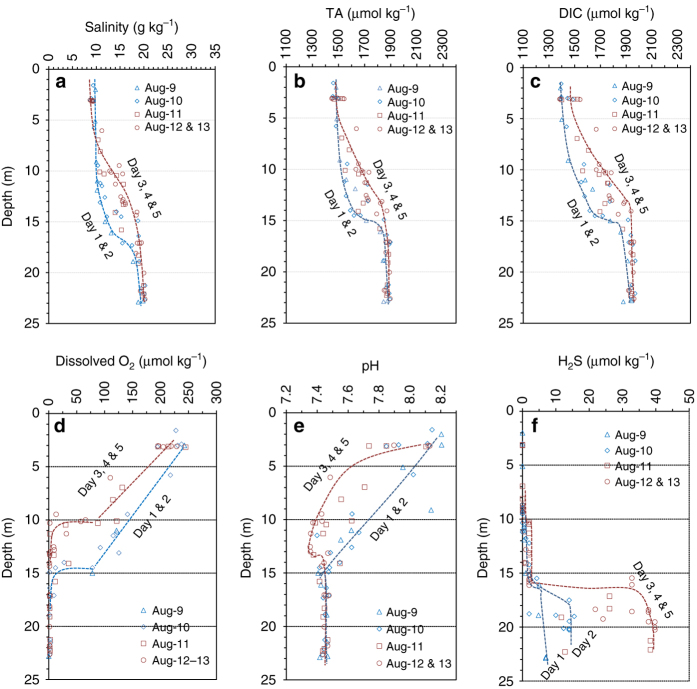
Fig. 2.
Vertical distributions of measured chemical properties at the focused study site in August 2013. a Salinity, b total alkalinity (TA), c dissolved inorganic carbon (DIC), d dissolved oxygen, e pH (25 °C and NBS scale), and f H2S concentration. See Fig. 1 for location (station 858). The lines are the lower and upper boundaries between days 1 and 2 and days 3–5, respectively. August 2014 data are presented in Supplementary Fig. 8 for comparison and affirmation of the 2013 observations

