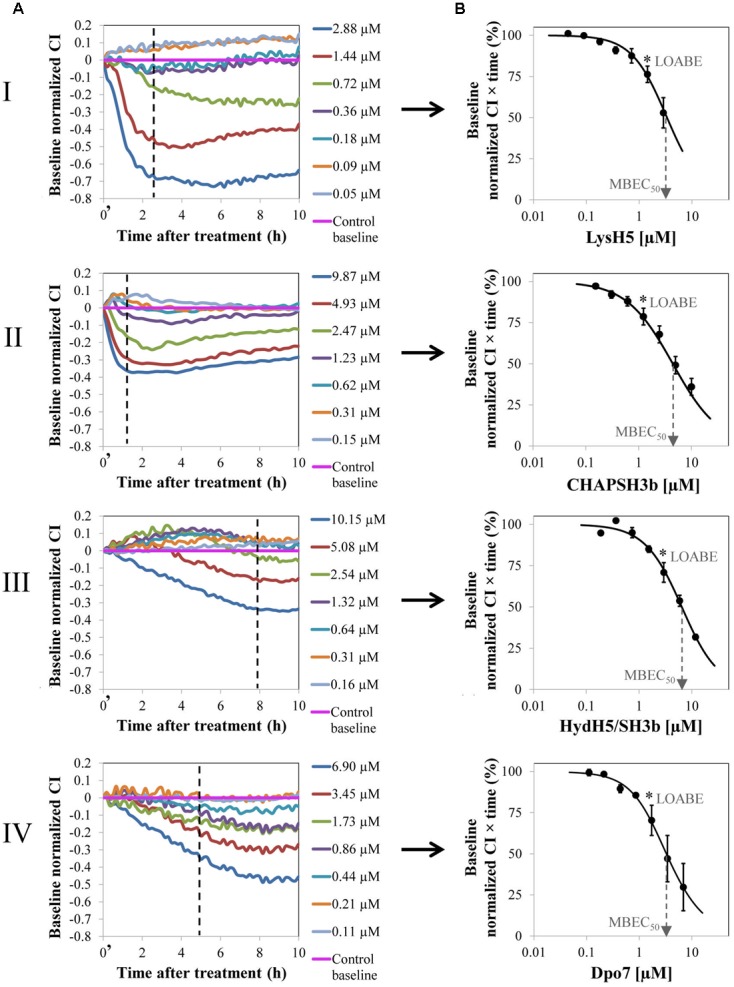
FIGURE 1.

Removal of 8 h-old preformed biofilm of S. aureus 15981 treated with increasing concentrations of phage-derived proteins: LysH5 (I), CHAP-SH3b (II), HydH5/SH3b (III), and Dpo7 (IV). (A) Variation of the baseline normalized cell index (CI) during biofilm treatment for one representative biological replicate out of three showing the same trend. Time t = 0′ in the x-axis represents the time 10 min after the beginning of the treatment. (B) Dose–response curve (DRC) fitted into a sigmoidal curve (R2 > 0.98) obtained by representing the baseline normalized CI vs protein concentration at a particular time (dashed line in A); each point in the curve corresponds with the mean (±standard deviation) calculated from three biological replicates. The dashed arrow indicates the MBEC50 value and the asterisk the LOABE value (see Table 1).
